The World
IPCC's Fourth Assessment Report (2007)

Climate change and its impacts affect global regions differently. For example, Canada's North is expected to experience the greatest level of warming and associated impacts, as the permafrost level drops and extent of ice cover are reduced. SaskAdapt is primarily concerned with Saskatchewan and the Prairie Provinces but to assist with your understanding here are some key data on global climate change. This data includes both historical temperature records and projections of future global temperature change. This data largely originates from the Intergovernmental Panel on Climate Change (IPCC) Fourth Assessment Report (AR4) prepared in 2007. This is the latest comprehensive report of the IPCC.
The key findings are presented in three sections:
- Observations of Climate Change
- Observed Effects of Climate Change
- Projections of Future Changes in Climate
1. Observations of Climate Change
i. Temperature is Increasing:

Figure 1: Evidence of Global Temperature Increasing
- The top graph shows global average surface temperature increasing by about 0.5 C since the 1950s;
- The middle graph shows global average sea level rising (from tide gauge (blue) and satellite (red) data);
- The bottom graph of snow cover for March-April for the Northern Hemisphere illustrates a downward trend
Source: (Pachauri and Reisinger, 2007, p 31)
Note:
- all differences are relative to corresponding averages for the period 1961-1990.
- smoothed curves represent decadal averaged values while circles show yearly values.
- shaded areas are the uncertainty intervals
Warming of the climate system is unequivocal, as is now evident from observations of increases in global average air and ocean temperatures, widespread melting of snow and ice and rising global average sea level. (Figures 1a, 1b, and 1c)
- Eleven of the twelve years between 1995 and 2006 rank among the twelve warmest years in the instrumental record of global surface temperature (since 1850).
- The temperature increase is widespread over the globe and is greater at higher northern latitudes. Average Arctic temperatures have increased at almost twice the global average rate in the past 100 years.
- Average Northern Hemisphere temperatures during the second half of the 20th century were very likely higher than during any other 50-year period in the last 500 years and likely the highest in at least the past 1300 (Figure 2).
- Other evidence of warming includes: Changes in the ocean and on land, including observed decreases in snow cover and Northern Hemisphere sea ice extent, thinner sea ice, shorter freezing seasons of lake and river ice, glacier melt, decreases in permafrost extent, increases in soil temperatures and borehole temperature profiles, and sea level rise.
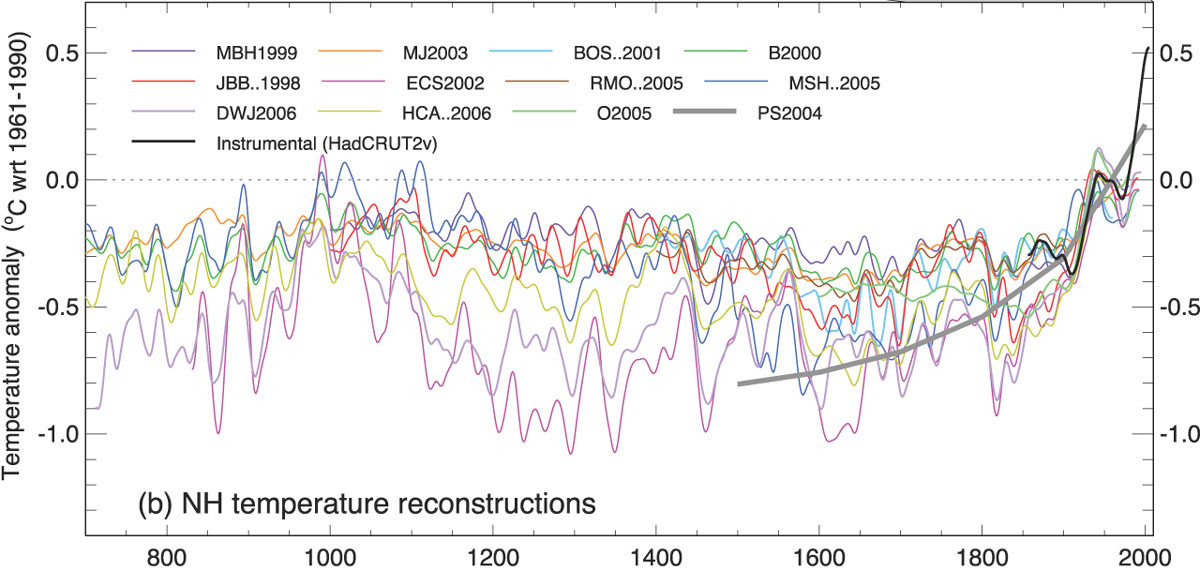
Figure 2: Evidence of Increasing Temperatures for the Northern Hemisphere
This illustrates the variation (from the 1961 to 1990 average) in temperatures for the Northern Hemisphere for the last 1300 years based on actual instrumental temperatures (the black line since the late 1800's) and reconstructions using multiple climate proxy records.
Source: (Solomon et al, 2007, p467)
ii. Precipitation Changes Vary by Location
Changes in trends from 1900 to 2005 have been observed in precipitation amount in many large regions. Over this period:
- precipitation increased significantly in eastern parts of North and South America, northern Europe and northern and central Asia whereas
- precipitation declined in the Sahel, the Mediterranean, southern Africa and parts of southern Asia.
iii. Extreme Weather Events Have Changed in Frequency and/or Intensity (over the past 50 years)
- It is very likely that hot days and hot nights have become more frequent over most land areas
- It is likely that heat waves have become more frequent over most land areas.
- It is likely that the frequency of heavy precipitation events (or proportion of total rainfall from heavy falls) has increased over most areas.
- It is likely that the incidence of extreme high sea level has increased at a broad range of sites worldwide since 1975.
- It is very likely that cold days, cold nights and frosts have become less frequent over most land areas,
2. Observed Effects of Climate Change
Natural Systems:
- Observational evidence from all continents and most oceans shows that many natural systems are being affected by regional climate changes, particularly temperature increases. {WGII SPM}
Terrestrial Biology:
- There is very high confidence, based on more evidence from a wider range of species, that recent warming is strongly affecting terrestrial biological systems, including such changes as:
- earlier timing of spring events, such as leaf-unfolding, bird migration and egg-laying; and
- poleward and higher elevation shifts in ranges in plant and animal species.
- Based on satellite observations since the early 1980s, there is high confidence that there has been a trend in many regions towards earlier ‘greening' of vegetation in the spring linked to longer thermal growing seasons due to recent warming.
Water:
- Based on growing evidence, there is high confidence that the following effects are occurring in aquatic systems:
- increased runoff and earlier spring peak discharge in many glacier- and snow- fed rivers, and
- warming of lakes and rivers in many regions, with effects on their temperature distribution and water quality.
- increased runoff and earlier spring peak discharge in many glacier- and snow- fed rivers, and
Human Environment:
- Effects of temperature increases have been documented with medium confidence in the following managed and human systems:
- agricultural and forestry management at Northern Hemisphere higher latitudes, such as earlier spring planting of crops
- alterations in disturbances of forests due to fires and pests
- some aspects of human health, such as earlier onset of and increases in seasonal production of allergenic pollen in Northern Hemisphere high and mid-latitude.
3. Projections of Future Changes in Climate
Continued greenhouse gas (GHG) emissions at or above current rates would cause further warming and induce many changes in the global climate system during the 21st century that would very likely be larger than those observed during the 20th century (Figure 3).
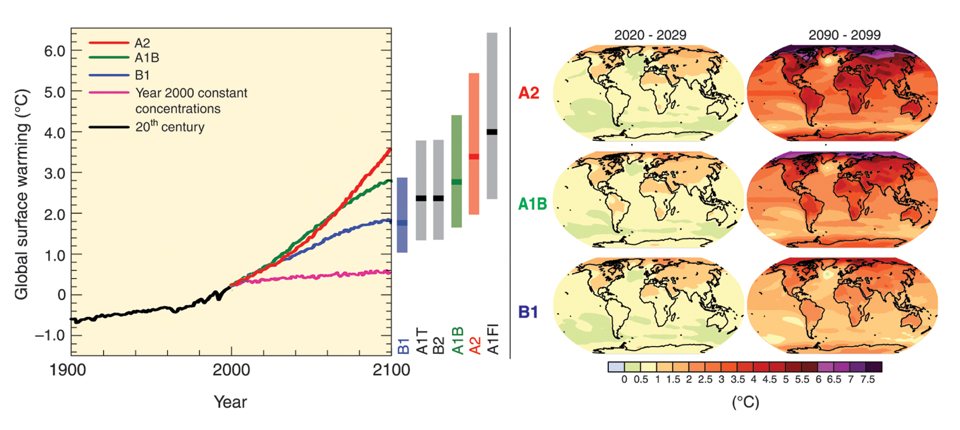
Figure 3: Temperature Projections
-
Left Panel: This illustrates the projected global average surface temperature changes based on various scenarios of future greenhouse gas emissions relative to (1890-1990). The solid lines represent the best estimate while the bars show the likely range in temperature changes. The pink line is for the model where concentrations are held constant at year 2000 values
-
Right Panel: This illustrates the projected surface temperature changes for the early and late 21st century relative to the period 1980-1999.
The panels show the average projections for 3 scenarios (A2, A1B, B1) averaged over decades 2020-2029 (left) and 2090-2099 (right).
Source: (Pachauri and Reisinger, 2007, p 46)
Temperature Continuing to Warm:
- For the next two decades a warming of about 0.20°C per decade is projected. (This compares with observed similar values since 1990).
- Warming is expected to be greatest over land and at most high northern latitudes, and least over the Southern Ocean (near Antarctica) and northern North Atlantic, continuing recent observed trends (Figure 3 right panels)
- Snow cover area is projected to contract. Widespread increases in thaw depth are projected over most permafrost regions.
- Sea ice is projected to shrink in both the Arctic and Antarctic.
Precipitation:
- Increases in the amount of precipitation are very likely in high latitudes,
- Decreases in precipitation are likely in most subtropical land regions, continuing observed patterns in recent trends.
Extreme Events:
- It is very likely that hot extremes, heat waves and heavy precipitation events will become more frequent.
Next Page › Saskatchewan's Climate
Sources:
- Pachauri, R.K. and A. Reisinger, A. editors (2007): Climate Change 2007: Synthesis Report, Contribution of Working Groups I, II and III to the Fourth Assessment Report of the Intergovernmental Panel on Climate Change, IPPC, Geneva Switzerland. p. 104.
- Solomon, S., Qin, D., Manning, M., Chen, Z., Marquis, M., Averyt, K., Tignor, M.M.B., and Miller, H.L., editors (2007): Climate Change 2007: The Physical Science Basis. Contribution of Working Group I to the Fourth Assessment Report of the Intergovernmental Panel on Climate Change. Cambridge University Press, 940 p.