Saskatchewan's Climate: Future
The Canadian Prairies have warmed at a faster rate than the global average and our future climate will be outside the range of our recent experience.
Climate Scenarios for Saskatchewan
Following recommendations outlined by the IPCC, PARC produced new scenarios of climate change for Saskatchewan using the most recent results from global climate models (Figure 1). Since future atmospheric composition will be dependent on factors including population, economic growth and energy use, the scenarios use a number of greenhouse gas emission levels, spanning a range of possible socio-economic futures. The final selection of scenarios was based on variation in the annual index of climate moisture. Moisture balance is a critical issue in the health of Saskatchewan's ecosystems and in the success of key industries such as agriculture, as well as affecting hydropower generation and water supply to industry and cities. The scenarios were constructed by determining the changes in average climate for the 30-year periods centred on the 2020s (2010-2039), 2050s (2040- 2069) and 2080s (2070-2099), relative to the 1961-1990 baseline period.

Results:
Increase in Temperature and Precipitation
Across a range of global climate models and greenhouse gas emission scenarios, there is a consistent increase in future annual temperature and precipitation throughout Saskatchewan. Mean annual temperatures are expected to rise at all sites (Figure 2). For southern Saskatchewan, annual temperature at seven selected sites increases such that by the 2020s, it is at least 1°C warmer than baseline conditions at all sites, and for Yorkton, 3°C warmer. Precipitation is also projected to increase across Saskatchewan (Figure 3).
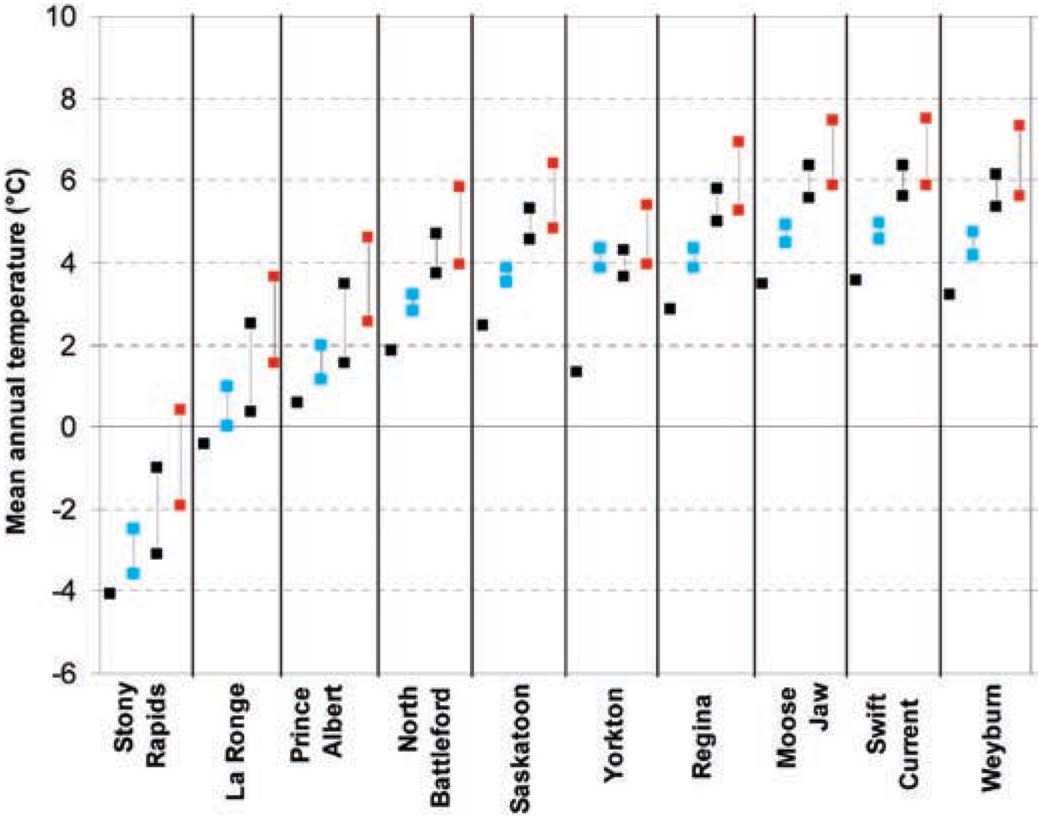
At each site there are four blocks of data: 1961-1990 baseline (black square) and the scenario ranges for the 2020s (blue high-low lines), the 2050s (black high-low lines) and the 2080s (red high-low lines). The scenario range has been calculated from the results of the three selected scenarios for each region.
NOTE: "Mean Annual Temperature" is the temperature at a given site averaged over the entire year.
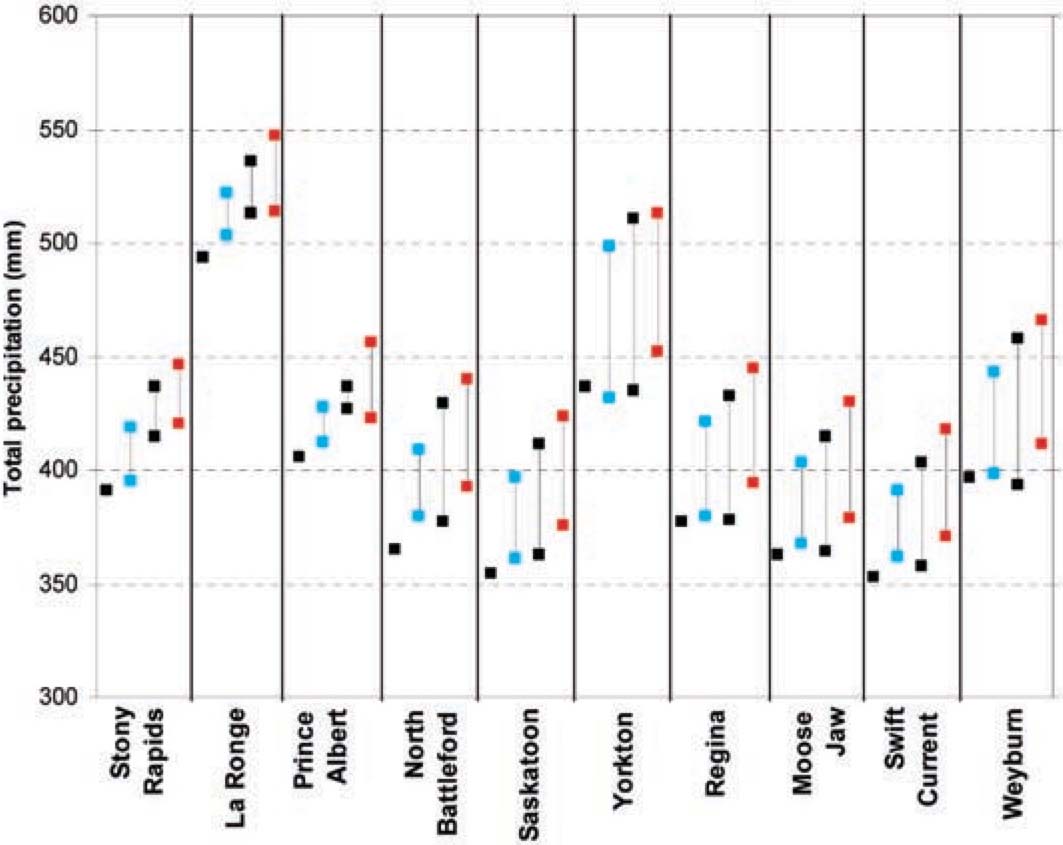
At each site there are four blocks of data: 1961-1990 baseline (black square) and the scenario ranges for the 2020s (blue high-low lines), the 2050s (black high-low lines) and the 2080s (red high-low lines). The scenario range has been calculated from the results of the three selected scenarios for each region.
Seasonal Variation in Temperature and Precipitation by the 2050s
As an example of seasonal variation, Figure 4 shows seasonal temperature change (+2°C to +4.5°C) and precipitation change (+2% to +17%) by the 2050s for North (4a) and South (4b) Saskatchewan.
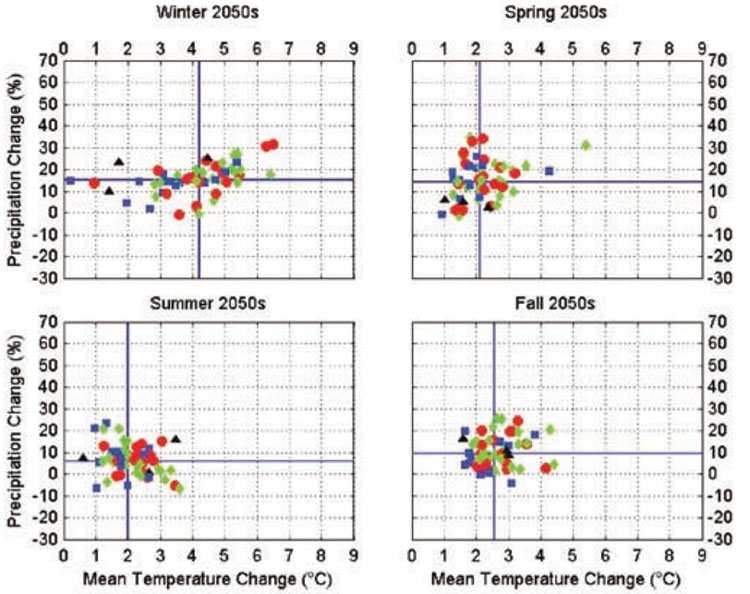
Figure 4 a): Seasonal Variation in Temperature and Precipitation for northern Saskatchewan
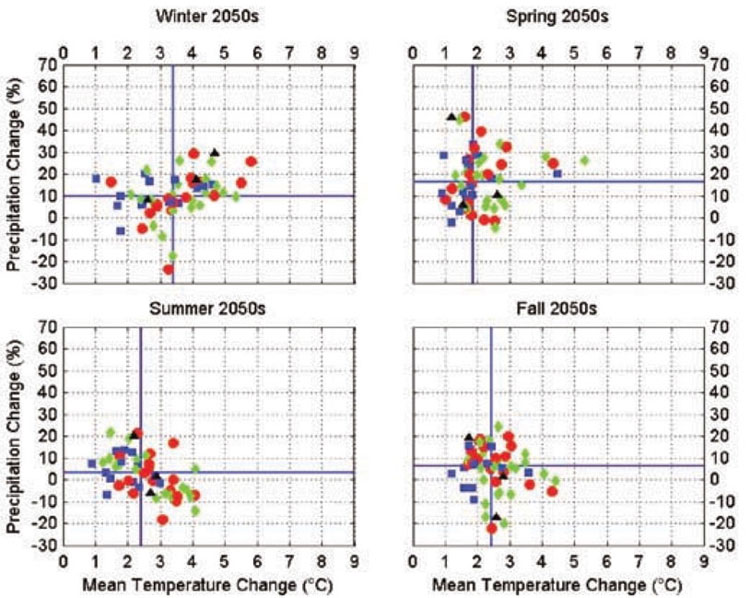
Figure 4 b): Seasonal Variation in Temperature and Precipitation for southern Saskatchewan
The above graphs (called “scatter plots”) show projected changes in mean temperature and precipitation for northern and southern Saskatchewan for the 2050s. The dots are scattered because different global climate models give slightly different predictions. The dots use different colours depending on the assumptions made by the global climate models about future greenhouse gas emissions (if we cut back on greenhouse gas emissions our temperatures will not rise as much). The blue cross-bar lines in the graphs indicate the average projections of change by the models. By looking at these cross-bars you can see that winter temperatures are expected to increase more than summer temperatures and that winter and spring are likely to see more of a precipitation increase than summer or fall.
Overall Drier Climate with Increased Variability
Overall, on an annual basis, our climate will be drier, owing largely to increased evapotranspiration from warmer temperatures. This trend is mapped in Figure 5, southern Saskatchewan, for the baseline period (1961-1990) and for three scenarios for the 2050s. Projections for northern Saskatchewan are similar.
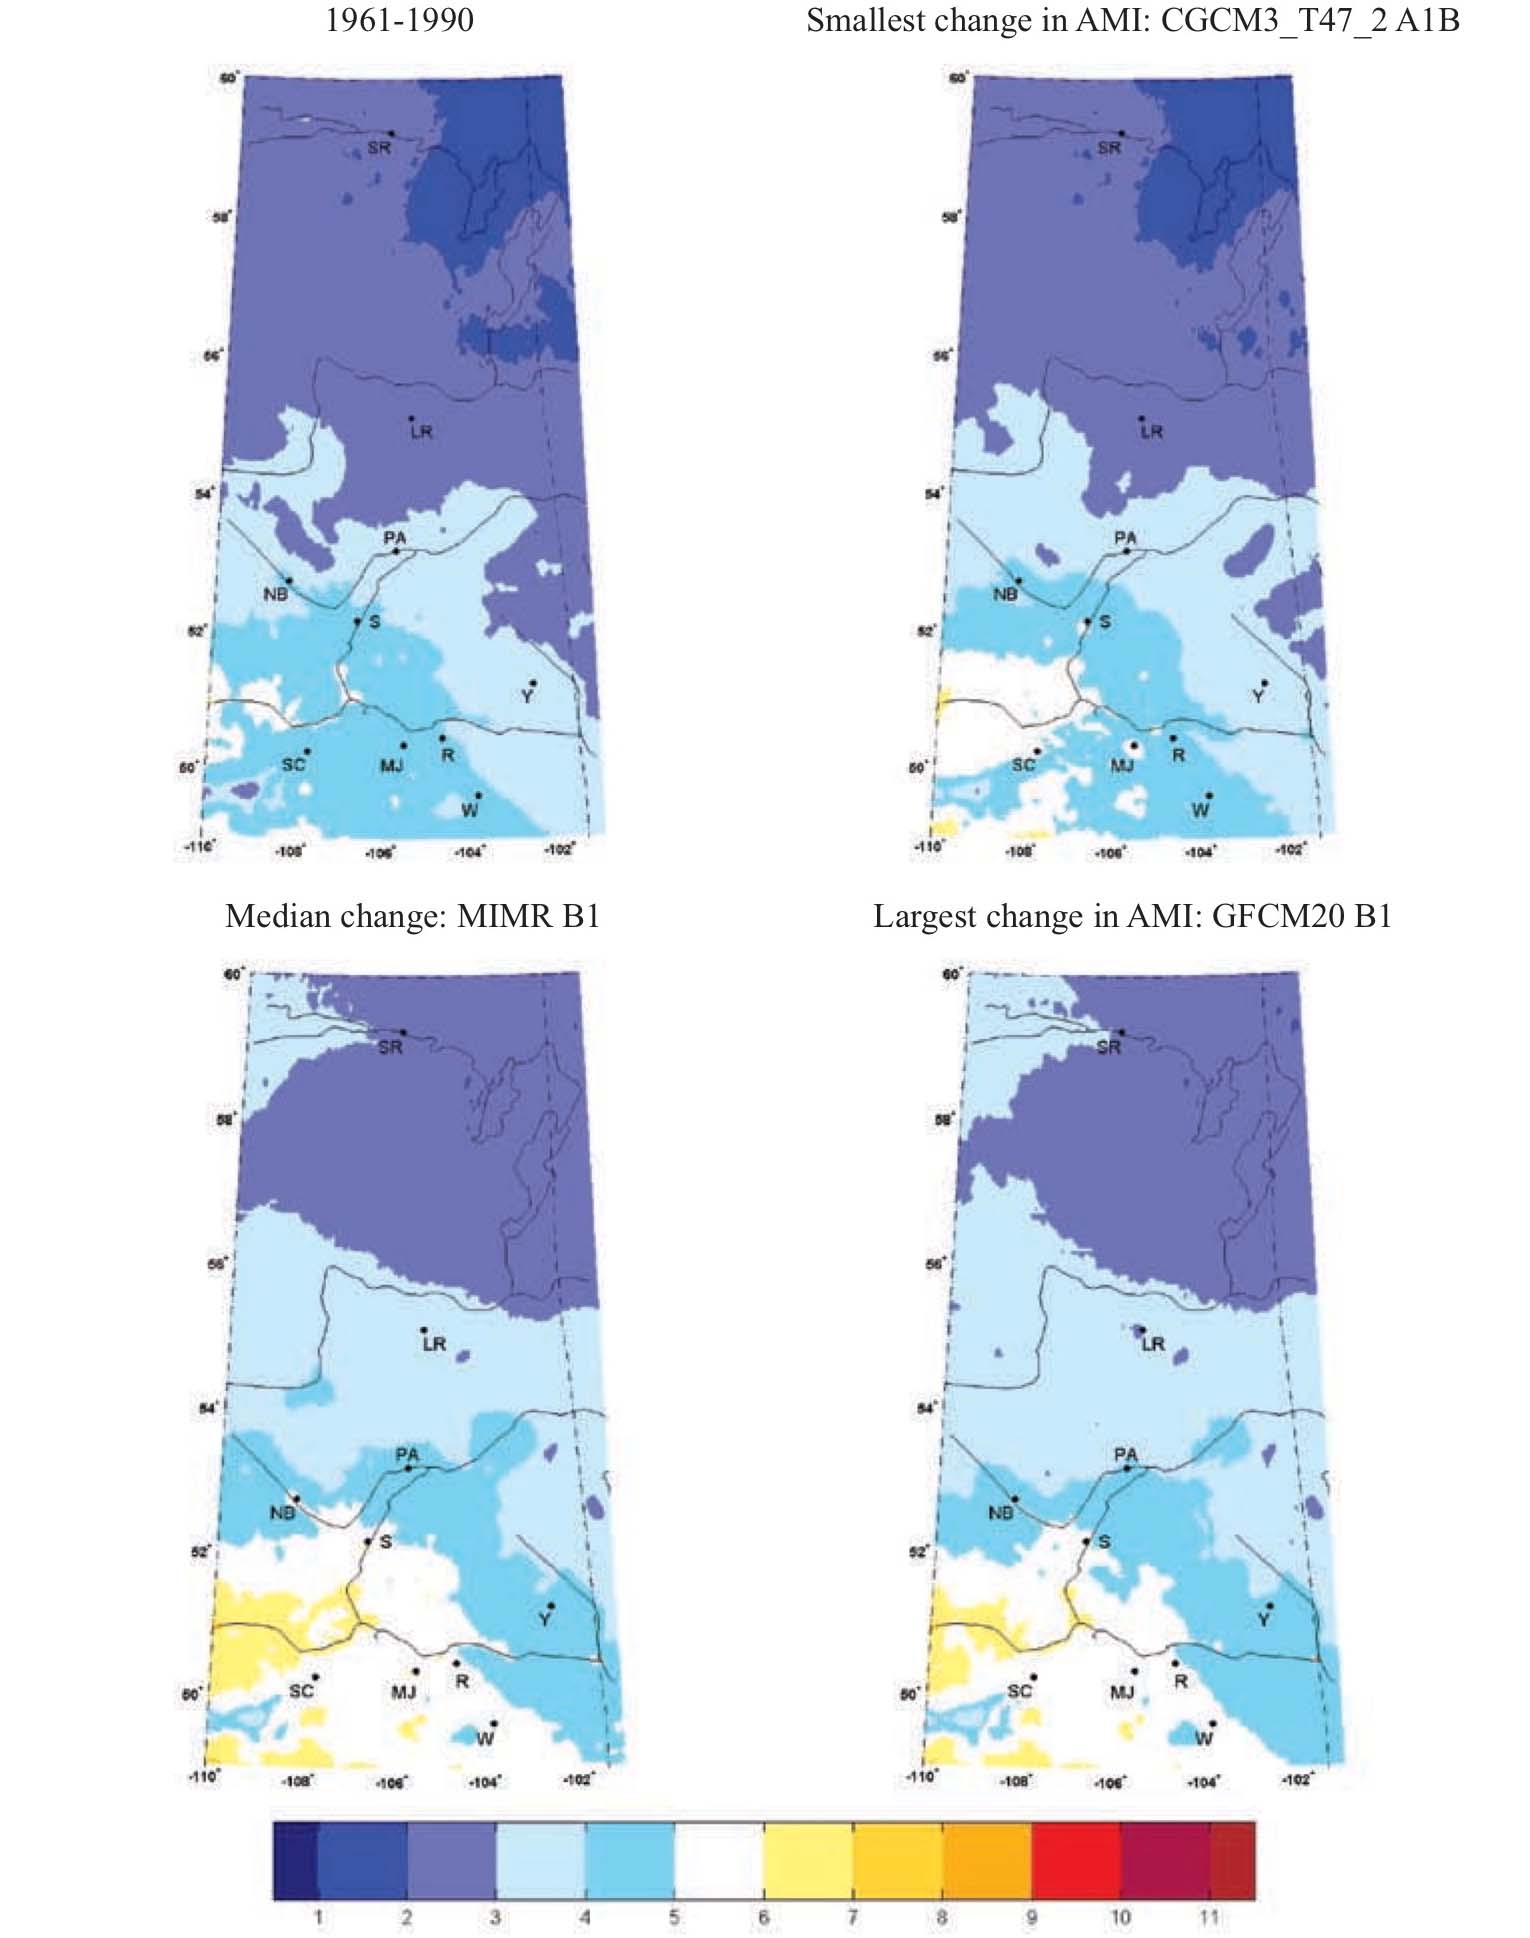
The annual moisture index gives an indication of moisture availability for plant growth and this index increases across all time periods for all sites (Figure 6) - indicating drier conditions at all localities and the potential for higher moisture stress. Effectively, what is happening is that increased evapotranspiration, driven by warmer overall temperatures, overwhelms the effect of increased precipitation, and leads to drier conditions.
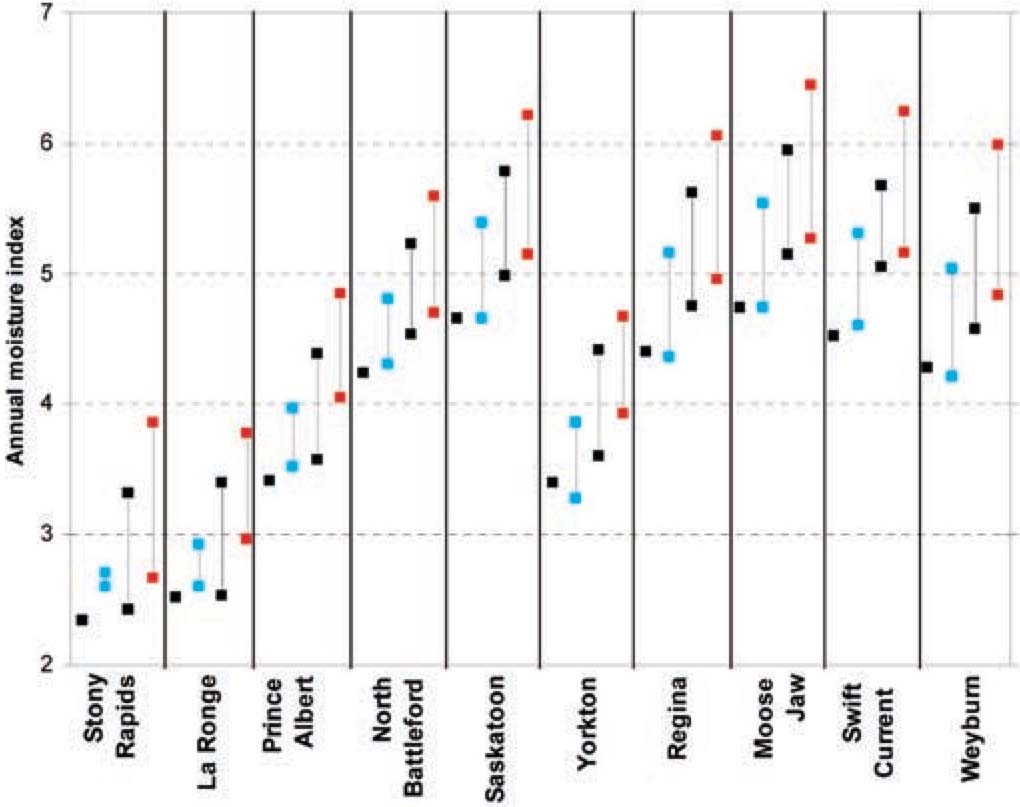
Figure 6: Annual Moisture Index for sites in Saskatchewan
At each site there are four blocks of data: 1961-1990 baseline data (black square) and the scenario ranges for the 2020s (blue high-low lines), the 2050s (black high-low lines) and the 2080s (red high-low lines). The scenario range has been calculated from the results of the three selected scenarios for northern and southern Saskatchewan.
The Impacts & Adaptation Options section will help you to understand the impacts of our future climate, and our adaptation options.
Next Page › Impacts & Adaptation Options for Saskatchewan
Sources:
- Barrow, E. (2009a): Climate Scenarios for Saskatchewan. PARC, 131 p.
- Barrow, E. (2009b): Climate Scenarios for Saskatchewan. PARC Summary Document No. 09-01, 15 p.
Footnote1 For a brief overview of GCM and emissions scenarios refer to the Canadian Climate Impacts Scenario website.