A Resource Guide for NVivo
IACC
Project
April, 2005
This is a
brief introductory overview and guide to NVivo for researchers and research
assistants undertaking community vulnerability assessment. NVivo will be used
for the analysis of the collected data and
preparation of project reports. The
purpose of this guide is to introduce researchers to the NVivo software in a
cursory manner. The guide lays out some
of the basic characteristics and functions of NVivo and it should be used with
the guides developed by the makers of the software.
NVivo is a software program developed by QSR. For an overview of the
software’s capacities, see QCR’s
NVivo website and the NVivo
product brochure. A very useful
document is QCR’s Getting
Started in NVivo, a guide that comes with
the software but that can also be accessed on-line in pdf format at the above
link. Similarly, the software comes with a more detailed reference guide. The NVivo software comes with tutorials that can also be accessed on-line, which can help the researcher to
further understand the capacities of the software. Another, useful resource is a book entitled Qualitative
Data Analysis: Explorations with NVivo written by Gramham Gibbs – this will
be made available to researchers. The NVivo software manual has been translated
into Spanish for more information on Introducción a NVivo (2): Manual de Trabajo see the following link.
Field methods for vulnerability assessment research undertaken in this project will take various forms including background histories, oral histories, structured and unstructured interviews and focus groups. For more information on this approach see the Resource Guide for Community Vulnerability Assessment developed for the IACC project. In out study of institutions and communities each form of observation will be recorded and transformed into computer files by the researcher. The result will be a large body of texts – interview transcripts, field notes and other observational records – that comprise the ‘data’ to be organized and analyzed. Qualitative data analysis consists of interpreting this body of data by organizing and drawing links between ideas and concepts emerging from the texts. Researchers then may develop more general concepts and theories, while retaining its complexity, that help make sense of the data in light of the research questions driving the project.
NVivo facilitates several aspects of the qualitative research process by helping record information, organize and code texts, and develop systematic links between texts and emerging theoretical concepts. The software allows researchers to record observations directly into Nivo or to import them into the program. Once data have been imputed or imported, codes can be assigned to texts to begin to organize and manage the data. Once we have created a database consisting of texts with their associated codes, researchers’ comments, and notes, the software allows for the easy organization and retrieval of portions of texts linked by common codes or concepts. In turn, this allows the research to explore patterns in the data and begin to conceptualize the findings. The data can be grouped and organized using different methods that assist the research in drawing out key findings. The NVivo software includes various tools for displaying the systematic relationships between coded texts, for example, in ‘trees’ and ‘models’.
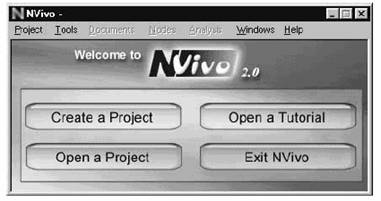
The first window to open when starting the NVivo software is the Launch
Pad (Figure 1). The Launch Pad provides
four possibilities as well as a tool bar similar to windows. From the Launch Pad you can:
- Create a Project
- Open an already existing Project
- Open a tutorial or
- Close the Program
FIGURE 1
Creating a Project
Even before researchers enter the field,
background research has begun and so has the process of documentation. Using NVivo, researchers begin by creating a
Project in which different documents are created and organized into different
categories. For example, a researcher
may have separate documents for background history, structured interviews,
unstructured interviews, semi-structured interviews, and focus groups as part
of a Project. A Project is created by
clicking on “Create a Project” from the Launch Pad screen. You do not need to
have information in order to create a project. Documents could be added at any
moment to a project that already exists. Projects could be “typical” - a
researcher or a group of researchers could have access to the project without restrictions
- or “customized’, where a member of the team acts as administrator and other
researchers need a password to have access to the project. Once you choose to
create a Project, the Project Pad screen is displayed, as shown below (Figure
2). Existing projects are also open in
this window by clicking in “Open a Project”
FIGURE 2
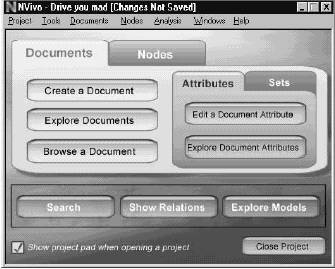
The Project Pad screen allows us to manage
documents and nodes in NVivo. Documents
are different forms of recorded data created in the process of field research. For example, you will have documents from
interviews and focus groups (i.e. you could have as many documents as
interviews and focus groups you had). Nodes are concepts, themes or categories
that emerge from your documents. The
Project Pad contains two tabs, one for Documents and one for Nodes, both of
which allow you to explore and manage your project. The Project Pad also gives you access to the
Attribute and Set tools. Both Documents
and Nodes can be given values of attributes and can be grouped into sets.
Creating a Document
Once you have started
your project, information you collect while in the field will be saved and
modified in different documents. The first tab on the project pad (Figure 2) is
for documents. From the Document Tab you
can:
- Create a
Project Document
- Explore
Project Documents
- Browse a
Document
To create a new document click on “Create Document”. From here a window
with the New Document Wizard will open, using which allows you to create or to
import documents as desired. The
Document Wizard will give you the following options:
- Locate and
import readable external text file(s) that you want to use as document(s).
- Make Proxy
Document(s) representing external file(s)
- Make a Proxy
Document for non-file data
- Make a new
blank document
If you choose “Explore Project Documents” from the Document Tab, the
following Document Explorer window will open (Figure 3):
FIGURE 3
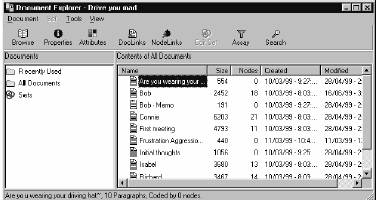
The tool bar along the top of the Document
Explorer allows you to perform various functions including browse, properties,
attributes, Doclinks and Nodlinks, which are be discussed in more detail
below. The window on the left of the
Document Explorer allows you to view recently used nodes, open sets, drag and
drop documents to make sets and to select documents and view size and coding
status. These functions will become
clearer as each of these is described.
The window to the right provides details about each document including
information such as the document title, size, nodes, creation date, etc. For example, if you have one document for
each community interview, you will see in this window as many documents as
interviews you have. You can, of course, collapse all of part of the documents
into a single one.
Finally the “Browse Documents” option allows
the user to apply basic word processing functions such as changing the font
size, font style, colour, etc. to a document.
This is done within the Document Explorer.
It is important to
note that in the case that data are not initially
recorded in an NVivo document, they can be imported into NVivo from other
formats such as Microsoft Word. However,
information to be imported must be saved as a Rich Text Format (.rtf)
document. You could also have complex
documents, with datalinks to other types of files (audio, films, photographies,
etc.).
Creating Nodes in the coding
process
Coding in NVivo is done
through the use of nodes. The QCR
tutorial notes that, “nodes are containers for
ideas and concepts and hold references to the passages of document text that
you code
at them”. Coding is done by linking a
passage in a document to a node. For example, you could create the node “drought”
and code one or more interviews (one or more documents) using this node. You
will end with a project node document that will contain all the sections of the
interviews that are related to the event “drought”. You then could analyze this
project node document looking for a more detailed account of the different
understanding of “drought”.
As
we have seen, the first tab on the project pad is used for creating, exploring
and browsing documents; the second tab is used for creating, exploring and
browsing nodes. In the initial stages of
coding, your coding categories will be free nodes, meaning they will be
unclassified and not part of a tree or case structure, which will evolve as
your data analysis evolves. You can view
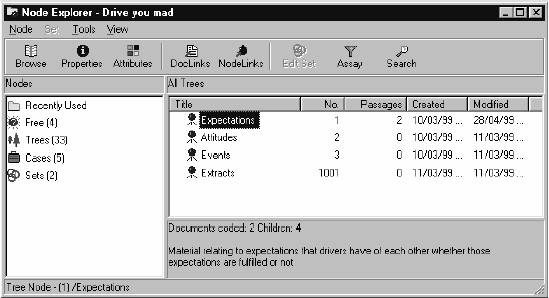
the coding you have completed in the Node Browser.
The Node Browser appears and functions
much like the Document Browser. It
allows you to see document text that is coded at a specific node. Like the Document Explorer, the Node Explorer
(Figure 4) - has a tool bar with various functions including browse,
properties, attributes, DocLinks, Nodlinks.
Unlike the Document Explorer, it also has the functions Edit Set, Assay
and Search included in this tool bar. The
left window of the Node Explorer allows us to see recently used Nodes, the number
of each type of Node, and sets. The
window on the right provides details such as document title, size, nodes, creation date,
etc.
FIGURE 4
The Node Tab on the Project Pad gives you the
following options:
- Create a Node
- Explore Nodes
- Browse a Node
If you choose to create a node you will be given a choice between three
types of nodes:
- Free Node
- Tree Node
- Case Node
Free Nodes are used when categories cannot be clearly separated into
a system that the researcher wants to treat as independent categories. These are often initial concepts or
categories that emerge from the data, which need further development or
classification. Free Nodes are nodes you have not arranged into relationships
with other nodes. If you choose to
create a Free Node, a window opens in which you can give the Free Node a title
and Description.
Unlike Free Nodes, Tree Nodes are nodes that have been organized into hierarchies of categories and subcategories, similar to the branches of a tree. Tree Nodes are developed using the Node Explorer window. The QCR website defines a tree node as “a node which is organised in a tree structure. Node trees normally have fairly generic concepts at the root of the structure and progress upward to more specific concepts”. For example, you could start using “Farmer” as a free node, but later you may decide to make distinctions among farmers, so that you develop “branches of farmer” as nodes: “grain farmer”, and “livestock farmer” or “mixed farmers”. Like Free Nodes, they are given a title and a description; however, they are also given an address so that they can be marked and ordered. Finally, the third type of node is a case node. A case node allows you to contain material about each case within this case node. Like the previous example you may have a case type node called “Farmers” and then each individual case node would be created under it storing the material for each of the farms in the project.
While using nodes will probably be
the most common way to code the data, visual coding or coding with attributes
are also possible. Further, coding
through nodes, by visual codes or attributes can be done separately or can be
used in combination. Visual coding is
done using the Document Explorer.
NVivo allows for
more than one way to code. You can code
using the coding bar (Figure 5) found at the bottom of both the Document
Browser and the Node Browser. Here you
select the text you want to code and the node you would like to code it to and
click on “Code”. Using the same procedure,
you can uncode.
FIGURE 5
![]()
Alternately, you can create a new node
by selecting text and clicking on “In-Vivo”, which creates a new free
node. Also, from the Document Browser
and the Node Browser you can click on Coder, which will open the Coder
window. From the Coder window you can
select the text you want to code by either selecting the node you want to code
it at and clicking “Code”, or by dragging and dropping the selected text onto
the node. Finally, you can code using
the paragraph Coder, Section Coder or the Search Tool. For more information on these please see page
32 in Getting
Started in NVivo.
Adding your ideas to the
data
As you read through
your data, which will be organized into documents, you may wish to add some of
your own ideas as the data is recorded.
This may help as data analysis is undertaken. An annotation can be attached to text as a
hyperlink, very much in the same way that you will write a note in the margin
when reading a book. This is done from
the Documents Browser by selecting links and then attaching Databite. To review an annotation after its creation,
select the relevant links and click on Inspect Databite.
Exploring the Data
The Explore
Document function on the Project Pad (Figure 2) allows you to see and organize
documents you have created. Once a
substantial amount of data has been created or imported into NVivo, you may
wish to run searches of the data for common themes. This is done by using the search button on
the project pad. Searches can be
performed on texts, nodes, attribute values or a combination of these. For
example, you could ask NVivo to search for all the interview documents that
have the node “drought” and separate them by the gender of the respondent (an
attribute). After running a search, you
can collect the documents found into a node and or attribute for further
reference.
While exploring the
data you may wish to create connections between different elements within the
data. This can be done in three ways:
using DataBites, DocLinks or NodeLinks.
DataBites connect a section of text with another section of text or an
external data source. DocLinks are used
to connect a document, a node or a place in the text with any number of other
documents. Like DocLinks, Nodelinks
connect a document, a node or place in the text with any number of other
nodes. These connections can be
established, modified or removed as necessary.
For more information on linking data, see page 28-29 in Getting
Started in NVivo.
Creating Attributes
An attribute is a
property (for example the age and /or gender of the respondent the day and/or
time of the interview, or any other feature that you think is important)
assigned to a document or node that allows for further classification and
organization of the data. From the
Project Pad, select Document then Create/Edit Document attribute. Next, type the name of the attribute you want
to use and click Apply. Attributes can
be viewed and modified in the Attribute Explorer. An attribute is most commonly a demographic
variable when the document represents the ideas of an individual. For example, if you wanted to look at how
different generations answered one of your interview questions, you might
include age as an attribute. You may
also employ a null value such as Not Assigned
(-), Unknown (?), or Not Applicable (NA).
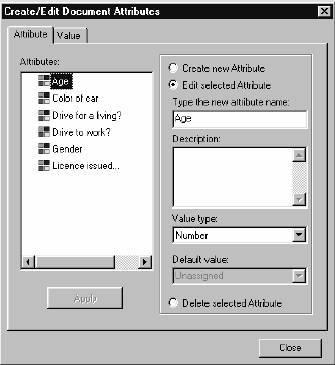
The following figure (Figure 6) shows us how to develop and define attributes. The window of the left lists existing attributes and the right screen allow you to create a new attribute and/or to edite a selected attribute. Each new attribute which is created is given a name, description, value type and, if desired, a default value. The selection of a value type is facilitated through a dropdown window which supplies attribute values such as strings, Boolean (true/false) numbers, dates, times etc. The default value is unassigned, that is represented as (-).
FIGURE
6
Creating a Set
Documents can be grouped into sets for further administrative organization. You may want to group all of the documents from a certain data collection period, or from one respondent or type of respondent, for example. For instance, we may want to establish a set of documents of interview with just “business people” – we can define this as a specific set allowing us to focus analysis only on this type of community member. A set is a grouping of documents or nodes you can use in order to access and work with these data as a group. Sets are used to assist in coding, to help develop models, to perform searchers, to group results from analysis, to group memos by themes, or to group nodes belonging to a specific area of analysis or to further organize the data.
Sets can be created using the Document Browser or the Node Browser. From the Project Pad select either or these and from there you can create or modify sets. To further edit the sets that you have created, you can use the Set Editor. The Set Editor will allow you to use the properties of a document to select them for use in sets.
For information on filtering a set or clarification on creating sets see page 34 in Getting Started in NVivo.
Creating Case Nodes and Node Attributes
To further organize and understand the data collected, you may want to create case nodes. For example, each participant interviewed in a focus group could become a case. A case node is created in the Node Explorer. We have seen how to create document attributes to organize documents; similarly, node attributes can be created to sort demographic information.
Conceptualization of findings
As previously discussed, some of the ways the researcher can conceptualize project findings is by using the Document Explorer to show relationships between documents and by further organizing them into sets. The Node Explorer also allows us to examine different nodes and relationships between them. Furthermore, nodes can be organized into sets using a Tree Node or grouped into Sets.
Besides sets, another way to show relations in your data is to use the Show Tool. From you Project Pad, select “Analysis” and then “Show Tool”. Once you select the items you want to look at, an explorer window will open from which you can use the item menu to carry out functions such as browse, edit, and explore the nodes, documents, attributes and sets as well as removing them if desired. Like the Show Tool, the Assay Tool is used to show relationships in your data; however, the Assay Tool is more detailed than the show tool. For instance, it can be used to show the proportion of documents in a set coded at a particular node. From the Document or Node Explorer, select Document and then Assay Document. The Assay Tool also allows you to develop a table to show your results. For more information on the Show Tool and the Assay Tool see page 36 and 37 in Getting Started in NVivo.
Using a Modeller is another way NVivo allows us to conceptualize the data. A Modeller uses icons to represent a range of features of the data and allows us to establish relationships between icons. To begin a model, open the Model Explorer by clicking on Explore Models from the Project Pad. Subsequent items nodes, links, properties, labels, and subtrees can be added to the model. Models can be layered as the process of data analysis develops.
Searching the Data
Another helpful tool is the Search Tool, which will allow you to search the data and if necessary group items found in the search. From the Project pad, click on Search Project Database and the Search Tool window will open. The Search Tool window allows you to:
- Run the search operation, allowing you to define what you want to search
- Select the scope or your search
- Decide what you want done with the search results
In defining what you want to search you can choose to search a node, an attribute or text or more than one of these if desired. Simple searches are done when you search a single dimension such as a node, attribute or text. To search a node you can also use the Node Explorer. Similarly, to search a value in an attribute you can use the Attribute Explorer.
An example of a simple search:
To search a specific node, click on the Node Lookup icon. From here you will need to indicate which node you want to search.
You can also run a simple search of unique attributes or of text – a word or phrase.
Besides simple searches, NVivo can run relational searches such as Boolean and Proximity searches. Unlike a simple search, relational searches deal with more than one node, attribute or text at a time. Boolean searches use commands such as “and”, “or” “not” and “less” to generate more complex searches, whereas proximity searches seek items that are near, precede or surround other items. For more information on the six different types of Boolean searches (intersection, union, negation, difference, matrix intersection and matrix difference) see page 45 in the Getting Started in NVivo. Similarly, for more information on Proximity searches (co-occurrence, sequence, inclusion, matrix co-occurrence, matrix sequence and matrix including) see page 46 in the guide.
Conclusion
The researchers and research assistants involved in the vulnerability assessment of communities and research on institutional capacities to deal with such vulnerabilities will be provided with a copy of NVivo Version 2, as well as the accompanying manuals, which can also be accessed on the internet (the links are provided in the introduction). Researchers will also be provided with the QSR Merge for NVivo program which is allows teams of researchers, such as those working on the IACC project to merge data together for further analysis. For an over view please see QSR Merge for NVivo.
Finally, QCR’s website provides access to different support mediums should the researcher encounter difficulties while using NVivo. QCR’s website offers a Help Desk in which help via e-mail correspondence can be obtained. Similarly, the website offers Forums in which product users can post inquires, search past inquires and communicate with each other.
The Information Technologies
Services at the London School of Economics offers the following brief
guide: Getting
Started with NVivo 2. As well, Patsy
Clarke of the
Hamilton Jemmott has written an article entitled Using NVivo in Qualitative Data Analysis, which describes her experience in using NVivo in her research which is example of how the software is used. Similarly, Elaine Welsh’s article Dealing with Data: Using NVivo in the Qualitative Data Analysis Process accesses the way in which NVivo is used in the data analysis process. Anette M. DeNardo and Lisa Lopez Levers have written a paper entitled Using NVivo to Analyze Qualitative Data, which details their research experience using NVivo.
For assistance regarding the use of NVivo for the IACC project please contact the IACC Project Director:
Department of Sociology and Social Studies
S4S 0A2
Phone: (306) 585 - 4151
Fax:
(306) 585 - 4815
E-mail harry.diaz@uregina.ca