Combining high-resolution regional climate modeling with a 900-year record of hydroclimatic variability to project the future climate of the North Saskatchewan River Basin above Edmonton, Alberta
Global Changes and Regional Responses
Global climate change has disrupted the hydrologic cycle, resulting in an increase of the frequency and severity of regional flood and drought events and a shift in the seasonal distribution of surface water supplies. These impacts are especially challenging in water-limited landscapes and where watershed hydrology is dominated by the melt of a cold season snowpack, which are characteristic of the mid- and high-latitude snow-dominated river basins of western Canada (Abbott et al., 2019; Marvel et al. 2019). This region has also been subject to considerable climate change as Canada has warmed at twice the global rate since 1948; while in western Canada the increase in temperature has been about three times more rapid than global warming (Bonsal et al., 2019; Mudryk et al., 2018). As a result, the flow of rivers draining the eastern slopes of the Canadian Rocky Mountains has declined in recent decades (St. Jacques et al., 2010).
Over the same period, there has been growing demand for the water supplied from the Rocky Mountains of western Alberta. The province has a population of about 4.3 million, and is home to Canada’s oil and gas industry and the majority of irrigated agricultural land. While the Rocky Mountains are the water towers of the western interior, most of Alberta is sub-humid, with large seasonal and inter-annual variability and extreme weather typical of a mid-latitude continental climate.
Alberta’s capital city, Edmonton, is Canada’s 5th most populous urban area with about 1.4 million residents. The water supply for this metropolitan region is the North Saskatchewan River Basin (NSRB). The headwater tributaries (Cline, Brazeau, Ram, and Clearwater Rivers) generate 88% of the total annual runoff (Golder, 2008). Glaciers and a high elevation snowpack maintain river flow through the summer months. At Edmonton, average annual temperature has risen by more than 2 degrees over the past 120 years. Most of the climate change has been an increase in the lowest temperatures; minimum daily winter temperatures have increased by 6 ° C (Anis et al., 2020). A decrease in the average annual flow of the NSR at Edmonton since 1911 is consistent with a warmer climate and the resulting loss of glacier ice and summer snowpack at high elevations in the headwaters of the basin. However, the decline is relatively small compared to large natural inter-annual and decadal variability in flow. Most of decreased flow is in summer; winter flows have been trending upward (Anis et al., 2020).
Applying High-resolution Modeling
Previous studies examining the impacts of climate change on runoff in the NSRB have applied coarse output from Global Climate Models (GCMs) to a hydrological model (Kienzle et al., 2012) or taken runoff data directly from the simple simulations of hydrology embedded in Regional Climate Models (RCMs), such as St Jacques et al. (2018). Our objective was to inform water supply and adaptation planning for climate change in the region with more advanced and higher resolution modeling of the climate and hydrology of the NSRB. We processed outputs from a 15-member ensemble of runs of the Canadian Regional Climate Model (version CanRCM4), then ran a fully calibrated numerical hydrological model using the future climatology from CanRCM4. This ensemble approach enables us to capture uncertainty resulting from the natural variability of the regional hydroclimate.
An ensemble of hydrographs under future climate conditions, and information about the future timing and magnitude of extreme water levels, informs a climate risk assessment of the resilience of water resource policy and infrastructure, which were designed to operate under historical climatic variability. Human-induced climate trends are superimposed on natural climatic variability, which is more evident and impactful at regional scales. Inter-annual and decadal scale variability of the regional hydroclimate is the dominant source of uncertainty in the projection of the future climate of Canada’s western interior (Barrow and Sauchyn, 2019). Our interpretation of the future contribution of natural variability is very much guided by our prior reconstruction of the flow of the NSR from tree rings (Sauchyn et al., 2011, 2015; Sauchyn and Ilich, 2017). This 900-year record of hydroclimatic variability includes evidence of prolonged periods of low flows exceeding in severity and duration from the minimum flows in the gauge record.
Anis et al. (2020) provided an overview of the impacts of climate change on water security in Canada’s western interior with a focus on the NSRB. The book chapter took a broad view, including reviews of historical changes in climate and hydrology, the paleohydrology of the past millennium, and data on water use and demand of past and future decades. This project, however, is focused exclusively on the projected changes in climate and river flow in the NSRB above Edmonton, with technical details and results not included in Anis et al. (2020).
The North Saskatchewan River Basin
Above Edmonton, the NSRB has a drainage area of 28,100 km2 and elevations ranging between 611 and 3,543 m above sea level (Figure 1). Three major physiographic regions – Rocky Mountains, foothills and plains – are evident from the elevations in Figure 1 and land cover image of the basin in Figure 2. The lower mountain slopes have a cover of montane and sub-alpine forests. The foothills support temperate needleleaf and mixed forest. The plains land cover is primarily cropping and temperate grassland, with some broadleaf deciduous forest (aspen parkland). While the sub-humid plains comprise about 60 percent of the drainage area, they contribute a small amount of discharge to the North Saskatchewan River (NSR).
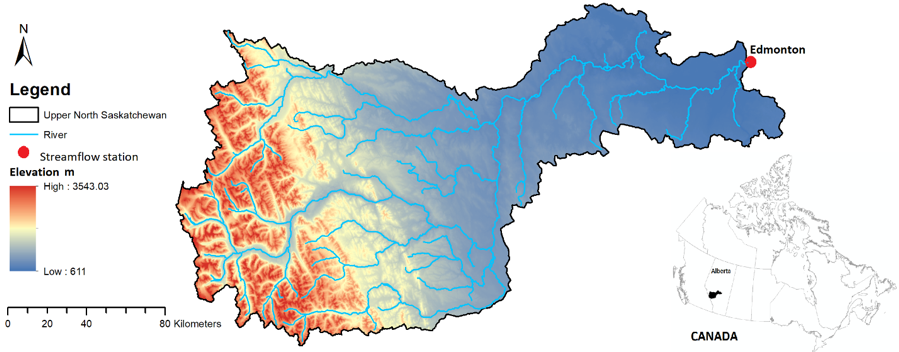
Figure 1: Physiography and river network of the NSRB above Edmonton, Alberta.
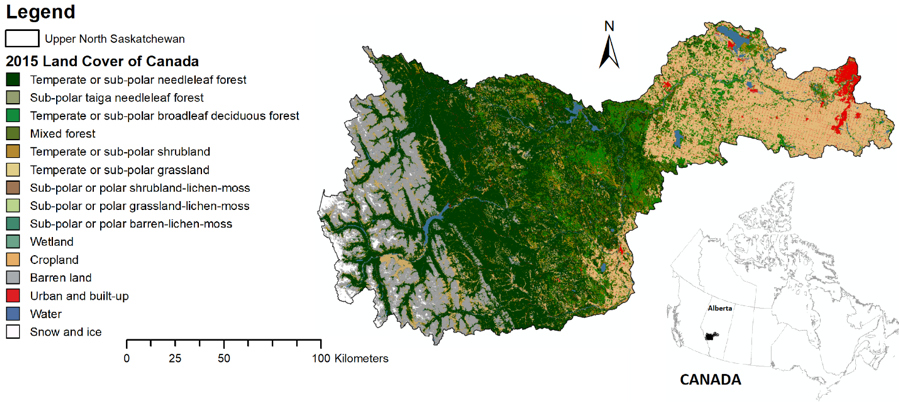 Figure 2: Land cover classification of the upper NSRB generated by the Canada Centre for Remote Sensing (CCRS).
The average annual precipitation across the entire drainage area is 619.5 mm (1979-2016); however, it varies from about 475 mm at Edmonton to more than 1,000 mm in the Rocky Mountain ranges. The average (1979-2016) minimum and maximum temperatures over this region are -12.3o C and 13.6o C, but also varies significantly between the mountains and the plains.
The mean annual discharge of the NSR above Edmonton is around 215 m3/sec. The origin of the NSR is the Saskatchewan Glacier in the Columbia Icefields. The glaciers of the Columbia Icefield experienced dramatic changes from 1919 to 2009, losing 22.5% of their total area while retreating more than 1.1 km on average (Tennant and Menounos, 2013).
Hydrologic Data
The Edmonton streamflow station (05DF001) recorded natural flows of the NSR prior to 1962. The Brazeau and Bighorn Dams were constructed in 1963 and 1972, respectively. These hydroelectric facilities shift the seasonal distribution of stream discharge, but have negligible influence on annual and peak flows at Edmonton. The River Forecast Centre of Alberta Environment and Parks computed natural flows at the reservoir sites, and by routing this runoff to Edmonton, produced a record of naturalized river flow. The daily natural / naturalized streamflow record for the NSR at Edmonton from 1912 – 2010 was used in the calibration of the hydrological model and validation of model output.
In Figure 3, water year hydrographs are plotted for three time periods. This comparison of historical natural flows of the NSR at Edmonton shows a decrease in the warm season (May – Sep) in the past 30 years, and an increase in the cold season (Oct – Apr). The total annual flows increased 3.46% for the period 1950-1979 and decreased 5.29% for the period 1980-2009 compared to a baseline period of 1912-1941. The recent changes in total annual flows reflect increased temperature and decreased snow pack.
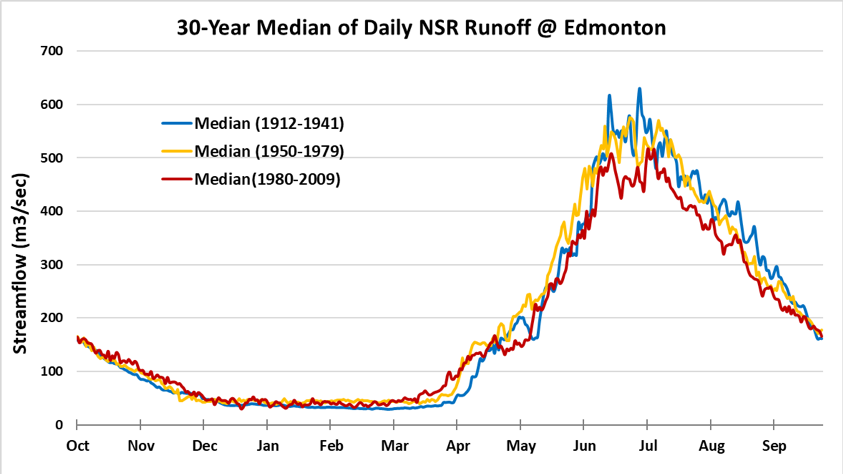
Figure 3: Comparison of median of 30-year daily natural streamflow for the NSR at Edmonton for three different time periods.
Detection and attribution of climate cycles is necessary to distinguish natural climate variability from trends imposed by global climate change. The wavelet transformation of time series assigns power to the spectrum of frequencies across the time domain. Figure 4 is a continuous wavelet plot for NSR natural streamflow at Edmonton from 1911-2010. The power at high frequencies (2-4 years) demonstrates the strong effect of the El Niño Southern Oscillation (ENSO) in this region. There is also an indication of decadal variability (8-32 years) which corresponds to the frequency of the Pacific Decadal Oscillation (PDO).
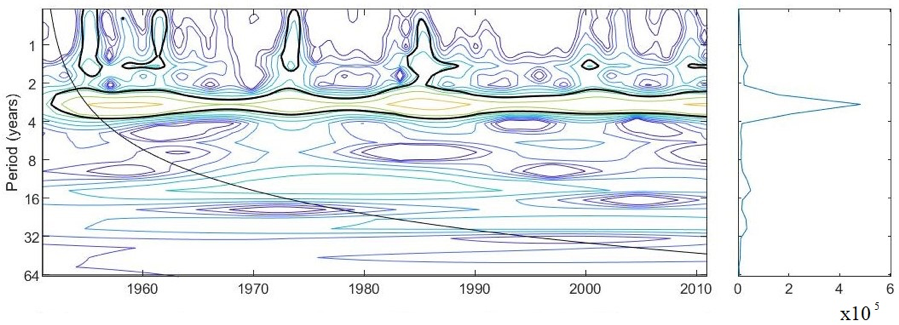
Figure 4: Continuous wavelet plot for NSR natural streamflow at Edmonton from 1911-2010
Historical Climate Data
The hydrological model was calibrated and validated using the WFDEI-GEM-CaPA bias-corrected 3-hourly 0.125o (~10km) historical (1979 – 2016) gridded meteorological forcing data (Asong et al., 2018; Asong et al., 2020). The drainage area of the NSR at Edmonton shown in Figure 5 is masked out for all seven variables required to run the MESH Land Surface hydrological model: incoming shortwave radiation, incoming longwave radiation, precipitation rate, air temperature, wind speed, barometric pressure, and specific humidity. This data set is a combination of the best available gridded data in Canada from the high-resolution forecasts of the Global Environmental Multiscale (GEM) atmospheric model and outputs of the Canadian Precipitation Analysis (CaPA) and the EU WATCH ERA-Interim reanalysis (WFDEI). A multivariate generalization of the quantile mapping technique was implemented to bias-correct WFDEI against GEM-CaPA at 3h × 0.125o resolution during the 2005-2016 overlap period, followed by a hindcast of WFDEI-GEM-CaPA from 1979. The product (WFDEI-GEM-CaPA, 1979–2016) for North America is freely available at the Federated Research Data Repository (https://doi.org/10.20383/101.0111).
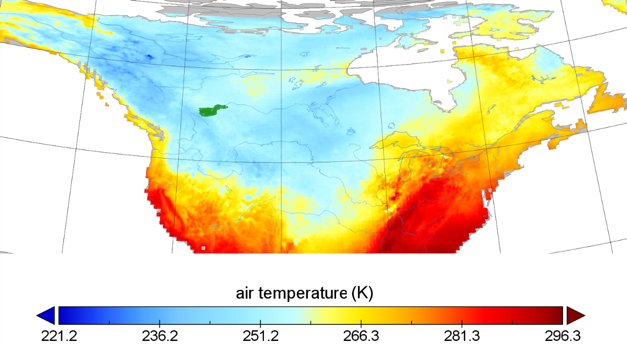
Figure 5: Drainage area of the NSRB above Edmonton (green) is masked out from the bias-corrected WFDEI-GEM-CaPA product (1979-2016)
Future Climate Data
This study uses an ensemble of 15 initial condition simulations from the Canadian Regional Climate Model version 4 (CanRCM4) under the RCP8.5 scenario (Scinocca et al., 2016). The 3-hourly 15-member ensemble of medium resolution (0.44o) extends from 1950 to 2100. The output was bias-corrected using the WFDEI-GEM-CaPA 3-hourly x 0.125o historical gridded meteorological data described above. The detail methodology is described in Asong et al. (2020). The resulting bias-corrected datasets at resolutions of 3-hours and 0.125o is a consistent set of climate projections suitable for large-scale modelling and future climate scenario analysis. The product is freely available from the GWF Cuizinart Data Repository at https://tuna.cs.uwaterloo.ca/.
MESH Hydrological / Land-Surface Scheme
The hydrology of the NSRB above Edmonton was simulated using the Modélisation Environmentale–Surface et Hydrologie (MESH) modelling system (Figure 6). MESH is a semi-distributed hydrological land-surface scheme developed by Environment and Climate Change Canada (Pietroniro et al., 2007). It has three components:
- The Canadian Land Surface Scheme (CLASS) (Verseghy, 1991; Verseghy et al., 1993) that computes the energy and water balances using physically-based equations for soil, snow, and vegetation canopy at a 30-minute time step;
- The routing scheme for the inter-grid transfer of channel flow (lateral movement) between soil and surface water to the drainage system with either of the algorithms WATROF (Soulis et al., 2000) or PDMROF (Mekonnen et al., 2014); and
- Hydrological routing using the semi-distributed hydrological model WATFLOOD (Kouwen et al., 1993) that collects overland flow and interflow from each grid cell at each time step and routes them through the drainage system.
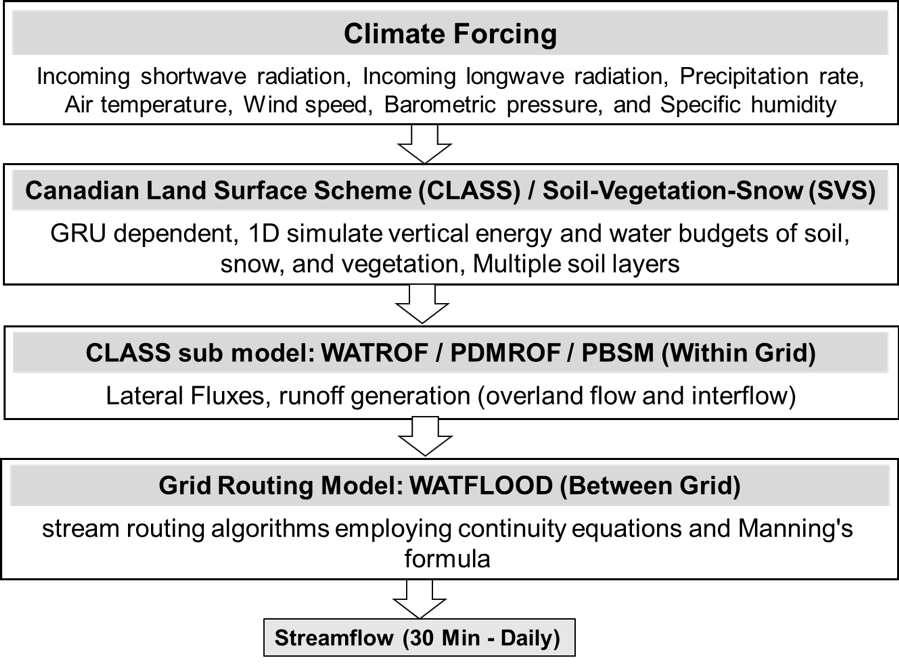
Figure 6: A schematic diagram of the MESH land-surface and hydrology modelling system.
A 0.125o (~10km) database for NSRB above Edmonton, consisting of 278 grid cells, was constructed using the Green Kenue tool (v3.4.3) as shown in Figure 7. Topographic data were from the Canadian Digital Elevation Data (CDED) at a scale of 1:50,000. The shape files of the catchment and rivers are available from the National Hydro Network – NHN – GeoBase Series. The soil data are from Agriculture and Agri-Food Canada. The 30-metre land-cover data (Figure 2; Pouliot el al., 2017) were obtained from the Canada Centre for Remote Sensing (CCRS, 2015).
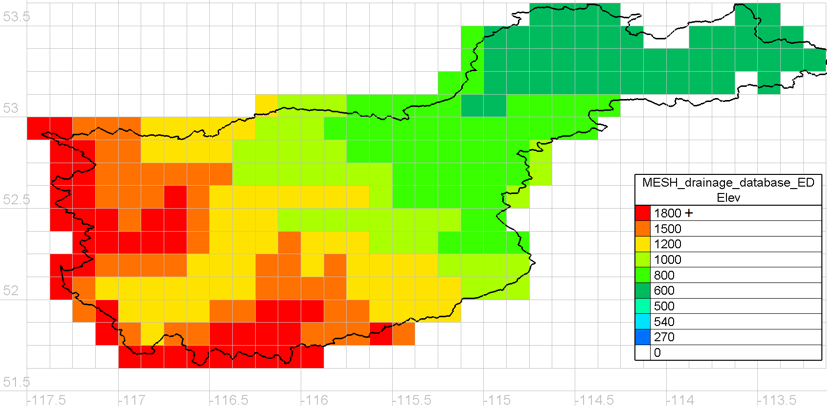
Figure 7: Drainage database of the NSRB above Edmonton. Each grid cell represents one Grouped Response Unit (GRU) with information of soil, land use, drainage area, elevation, channel length and slope.
Figure 8 shows the twelve land-cover types that were used to define the GRUs. For computational efficiency, a GRU-based approach combines areas of similar hydrological behaviour to address the complexity and heterogeneity in the drainage basin. Each model grid cell is represented by a limited number of distinct GRUs (tiles) weighted by their respective cell fractions. For large basins, this approach has been found more appropriate because of its operational simplicity while retaining the basic physics and behaviour of a distributed model (Pietroniro and Soulis, 2003).
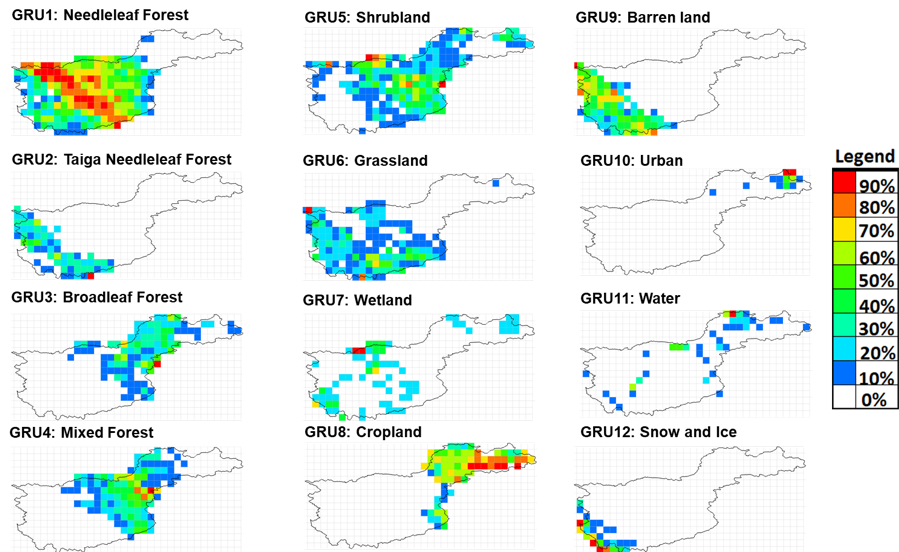
Figure 8: Twelve land use CLASS types and their fraction in each grid, used in the MESH Model of NSRB above Edmonton.
Model Optimization
For details on the coupling of the MESH model with OSTRICH, please see the following link:
The MESH model was coupled with the OSTRICH (Matott, 2017) optimization toolkit for Multi-Objective Optimization using the PADDS (Pareto Archived Dynamically Dimensioned Search) algorithm. Three families of parameters were calibrated: vegetation, soil, and hydraulics (Table 1).
| Parameters Type | Variable | Description |
| Vegetation Parameters | LNZ0 | Natural logarithm of the roughness length of the vegetation category or land cover |
| LAMX | Annual maximum leaf-area index of the vegetation category | |
| ALVC | Average visible albedo of the vegetation category when fully-leafed or of the land cover | |
| RSMN | Minimum stomatal resistance of the vegetation category | |
| ALVC | Average visible albedo of the vegetation category when fully-leafed or of the land cover | |
| CMAS | Annual maximum canopy mass of the vegetation category | |
| ROOT | Annual maximum rooting depth of the vegetation category | |
| QA50 | Reference value of shortwave radiation used in the calculation of the stomatal resistance of the vegetation category | |
| VPDA | Vapor pressure deficit coefficient ‘A’ used in the calculation of the stomatal resistance of the vegetation category | |
| VPDB | Vapor pressure deficit coefficient ‘B’ used in the calculation of the stomatal resistance of the vegetation category | |
| Soil Hydraulic Parameters | MANN | Manning’s ‘n’ |
| SDEP | Permeable depth of the soil column | |
| DD, DDEN | Estimated drainage density of the GRU | |
| WFCI, KS, KSAT | Saturated surface soil conductivity | |
| Soil Texture Parameters | SAND | Percent content of sand in the mineral soil |
| CLAY | Percent content of clay in the mineral soil |
Table 1: Parameters used in the calibration process for each CLASS type using OSTRICH optimization toolkit.
The objective function consists of weighted values of Nash-Sutcliffe efficiency (NSE) for peak flows, Log of Nash-Sutcliffe efficiency (lnNSE) for low flows and percentage of bias for volume correction. Figure 9 shows the rate of convergence of weighted Multi-Objective Optimization of the MESH hydrological model using OSTRICH. The simulation with the lowest objective function value of 0.14 was used for validation and the projection of future flows.
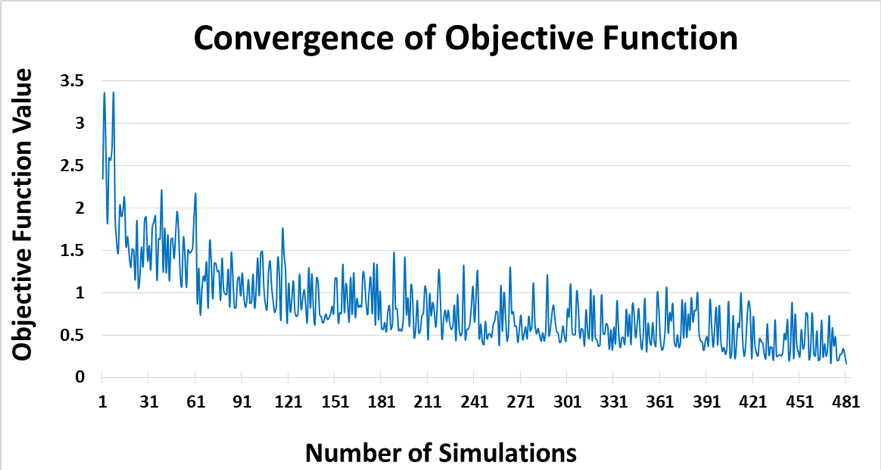
Figure 9: Convergence rate of the objective function defined for NSRB in OSTRICH.
Climate Projections
From the ensemble of 15 initial-condition CanRCM4 (RCP8.5) simulations of the climate of the NSRB above Edmonton, we computed the mean annual and seasonal differences in temperature and precipitation between the baseline period (1980-2010) and the near (2021-2050) and far future (2051-2080). Figure 10 shows a rise in mean annual temperature of around ~2° in near future and ~4° in far future. The intra-model variability in precipitation is higher in the far future as compared to near future.
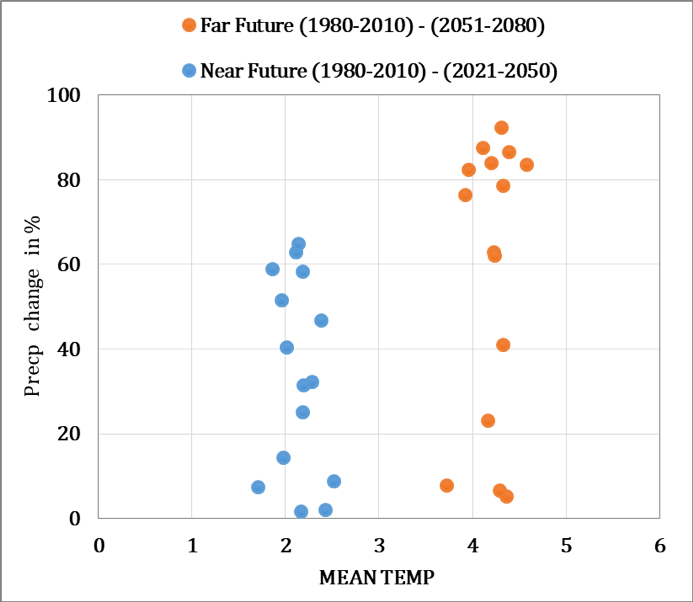
Figure 10: Mean temperature and precipitation change for the ensemble of 15 initial condition simulations from CanRCM4 and the RCP8.5 scenario for the NSRB above Edmonton.
Figure 11 displays the seasonal climate changes. The largest increases in minimum temperatures, exceeding 6° C in the far future, occur in winter. The rise in maximum temperatures is largest in summer. Precipitation is increasing in all seasons except summer; when there are both drier and wetter ensemble projections. There is much less intra-model variability in precipitation in summer than in the other three seasons.
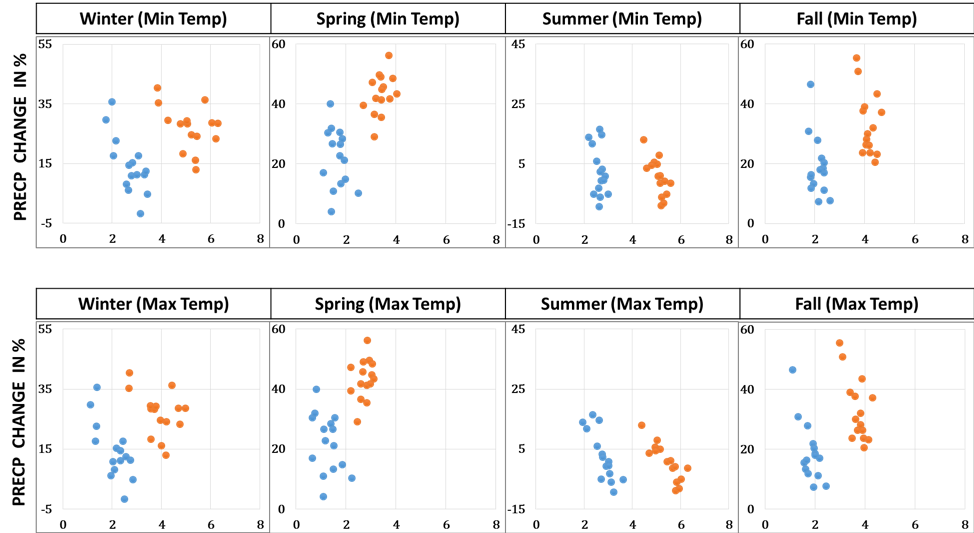
Figure 11: Seasonal changes in temperature and precipitation from the ensemble of 15 CanRCM4 initial condition simulations under the RCP8.5 scenario for the NSRB above Edmonton.
Figure 12 is a time series (1951-2100) of total annual precipitation produced by the 15-member CanRCM4 ensemble (RCP8.5). The intra-model variability increases over time towards the end of century around a rising linear trend and ensemble median. Seasonal time series (Figure 13) indicate that spring has the highest increasing trend as the wettest months shift to earlier in the year. Summer has a decreasing trend and highest intra-model variability with a large range between wet and dry years.
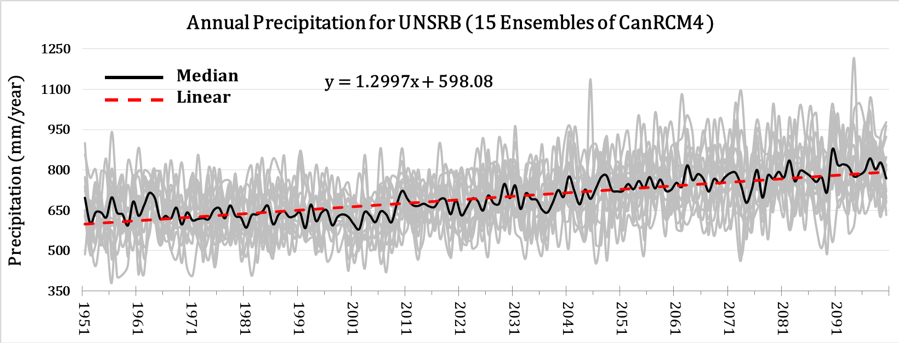
Figure 12: Times series (1951-2100) of total annual precipitation for the 15-member CanRCM4 ensemble (RCP 8.5). The ensemble median and linear trend are shown.
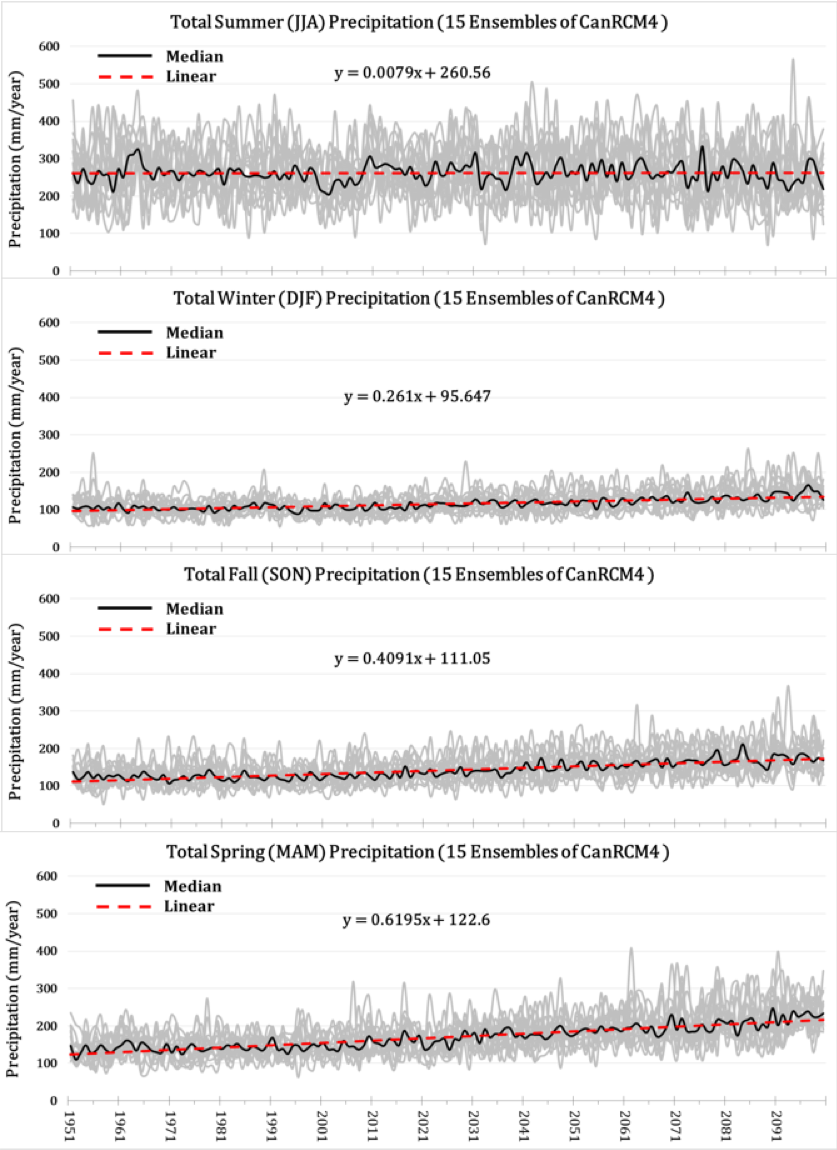
Figure 13: Times series (1951-2100) of total seasonal precipitation for the 15-member CanRCM4 ensemble (RCP 8.5). Ensemble medians and linear trends are shown.
Changes in extreme temperature are evident in the probability distribution functions (PDFs). In Figure 14, PDFs are plotted for daily maximum / minimum temperature on an annual basis and for the summer and winter seasons for contrasting 60-year baseline (1951 -2010) and future (2041-2100) periods. The bias corrected CanRCM4 (RCP 8.5) data were fitted with a normal distribution. There is clear shift in the PDFs towards higher future mean temperatures; however, a shift in the tails of the distributions differs between seasons, with increased minimum temperatures in winter and higher maximum temperatures in summer.
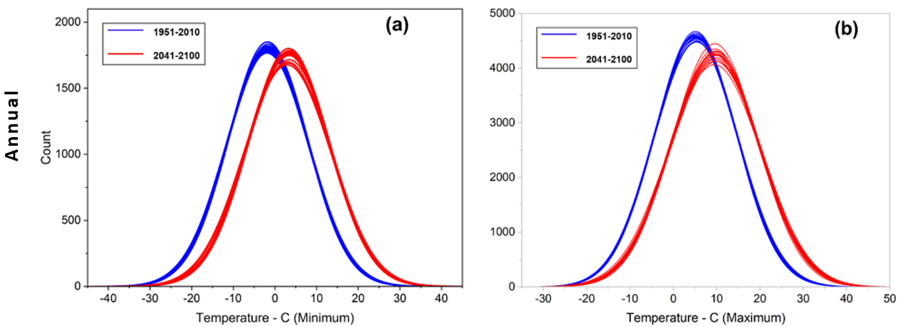
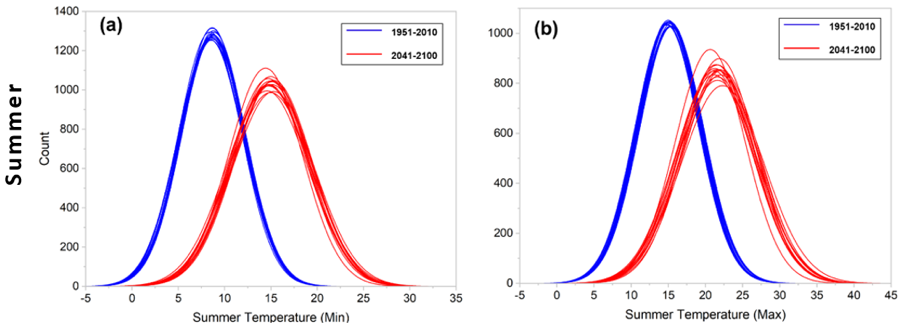
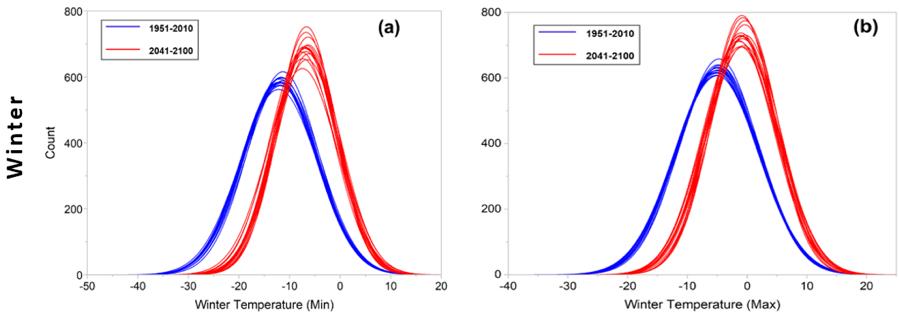
Figure 14: Daily minimum (a) and maximum (b) temperature per year and for the summer/winter seasons for contrasting 60-year baseline (1951 -2010) and future (2041-2100) periods. The bias corrected CanRCM4 (RCP 8.5) data were fitted with a normal distribution.
MESH Modelling of Future Flows of the NSR at Edmonton
Calibration and Validation of the MESH Model
The MESH hydrological model was calibrated and validated using the bias-corrected WFDEI-GEM-CaPA historical gridded climate data (Asong et al., 2018). Figure 15 is a plot of observed and simulated daily flow of the NSR at Edmonton for calibration (Feb 1995 – Dec 2002) and validation (Jan 2003 – Dec 2010) periods. Table 2 gives statistics for goodness of fit. The calibration Nash-Sutcliffe efficiency (NSE) of 0.69 indicates good agreement between modeled and observed flows. The overall performance of model dynamics and the seasonal variability in river flow is captured well by the MESH model with a percentage bias of 4.04 indicating a strong relationship between simulated and observed flows. MESH provides a close fit to the recorded flows for the calibration period, while for the independent validation period the performance is somewhat reduced, as expected in validation mode. The reduction is, however, limited and the model is able to maintain a very good representation of the overall water balance and the inter-annual and seasonal variations.
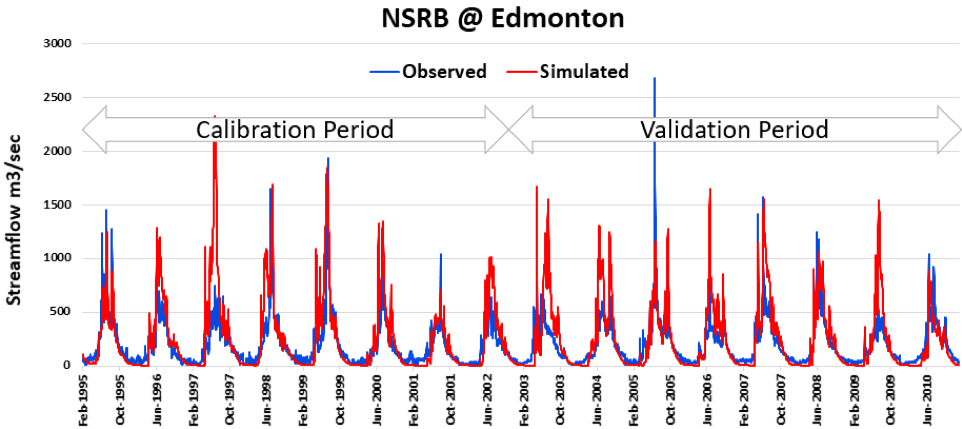
Figure 15: Comparison of observed and simulated daily runoff of NSR at Edmonton for calibration (Feb 1995 – Dec 2002) and validation (Jan 2003 – Dec 2010) periods.
| Calibration (Feb 1995 – Dec 2002) | Validation (Jan 2003 – Dec 2010) | |||||
| Goodness of fit | Nash-Sutcliffe efficiency (NSE) | Log of Nash-Sutcliffe efficiency (lnNSE) | % Bias | Nash-Sutcliffe efficiency (NSE) | Log of Nash-Sutcliffe efficiency (lnNSE) | % Bias |
| 0.69 | 0.4 | 4.04 | 0.67 | 0.32 | 5.11 | |
Table 2: Goodness of fit results for the calibration and validation of the MESH modeling of the flow of the NSR at Edmonton.
Streamflow Projections
The future flows of the NSR at Edmonton were simulated using bias-corrected data from 15 runs of the Canadian Regional Climate Model (CanRCM4) under the RCP8.5 emission scenario (Asong et al., 2020; Scinocca et al., 2016). Figure 16 is a plot of MESH simulated mean annual runoff at Edmonton from 1951 – 2100. This ensemble of time series exhibits large variably around an upward trending ensemble mean, with an increasing range between high and low flows towards the end of 21st century. These results are based on the future climate from the CanRCM4 dynamical downscaling of the Canadian Earth System Model (CanESM2). The use of a single pairing of ESM/RCM and one RCP enables us to control for uncertainty due to the use of different models and greenhouse gas emission scenarios. Thus, differences among streamflow projections represent uncertainty related to the natural variability of the regional hydroclimate in a warming climate.
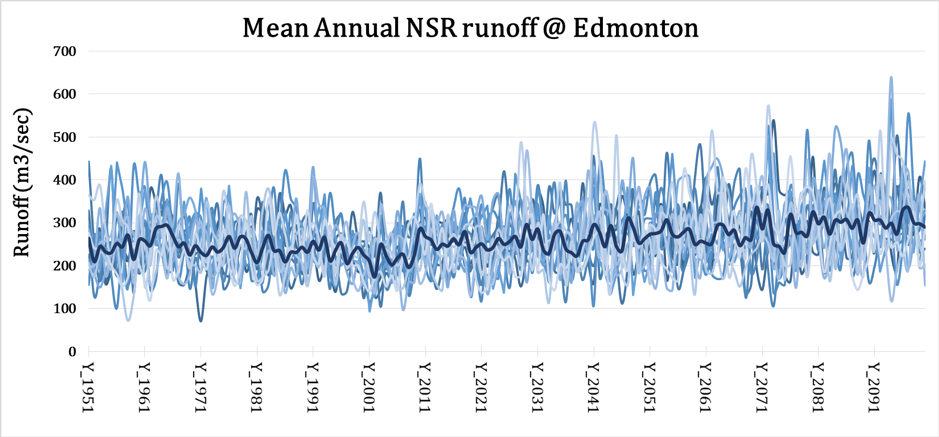
Figure 16: MESH simulated mean annual runoff of the NSR at Edmonton from 1951 – 2100. The model was driven with data from an15-member ensemble of bias corrected data from CanRCM4 (RCP8.5). The bold curve is the ensemble mean.
Figure 17 is a plot of the annual water-year hydrograph for the baseline (1951 – 2010) and future (2041 – 2100) periods derived from the MESH hydrological model run with the 15-member ensemble of bias-corrected CanRCM4 data (RCP 8.5). It clearly shows a shift in annual peak flows occurring approximately one-month earlier in the year, with higher winter flows and lower summer flows. A minor peak in late April – early May in the historical hydrograph is not apparent in the future flows. This suggests that at lower elevations, the landscape no longer contributes significant runoff in a warmer climate. A shoulder of sustained flow in September in the historical hydrograph also disappears, as future river flow steeply declines in summer and remain low as snow and glacier cover at high headwater elevations is much reduced.
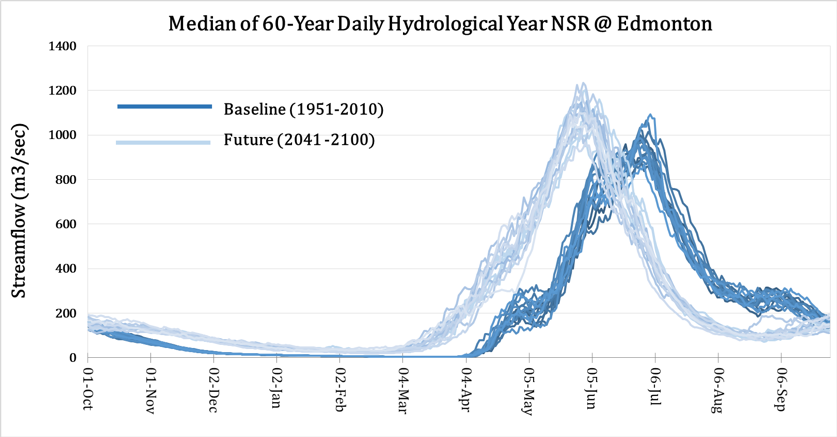
Figure 17: Comparison of median 60-year daily NSR flow at Edmonton for baseline (1951 – 2010) and future (2041 – 2100) periods. These hydrographs were generated using the MESH hydrological model run with the 15-member ensemble of bias-corrected CanRCM4 data (RCP8.5).
In Figure 18 and 19, the frequency of daily mean and high/low flows, respectively, are shown by fitting a normal distribution to histograms of the daily mean and extreme flows of the NSR at Edmonton. The ensemble of probability distributions derived from 15 runs of MESH is plotted for the baseline (1951 – 2010) and future (2041 – 2100) periods. In Figure 18, a shift in probability towards higher flows reflects the projected climate changes, and specifically wetter conditions in winter and spring. The right tail of the distribution of future daily flows is extended. This higher probability of high flows is depicted in Figure 19b, where the frequency of flows exceeding 500 m3/s is plotted. The PDF of low flows (< 500 m3/s; Figure 19a) suggests a decrease in frequency and an increase in magnitude. The high flow PDFs (Figure 19b) have longer tails in the future period indicating a much higher probability of flood events.
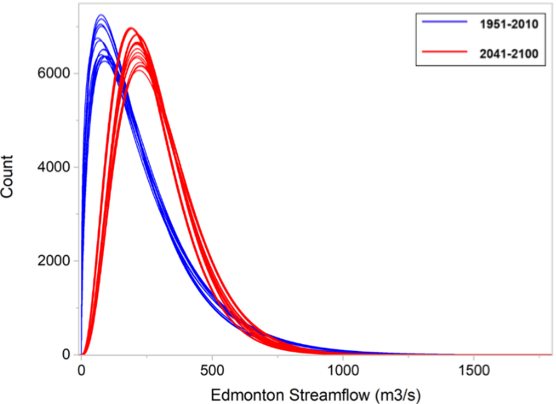
Figure 18: Comparison of normal distributions fitted to the histograms of daily mean NSR flows at Edmonton for a baseline (1951 – 2010) and future (2041 – 2100) periods.
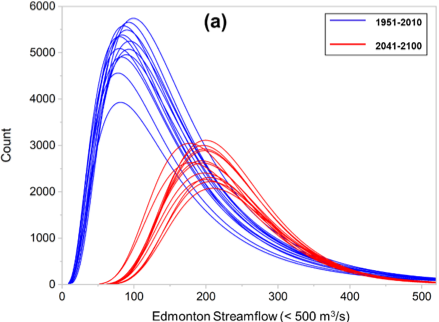
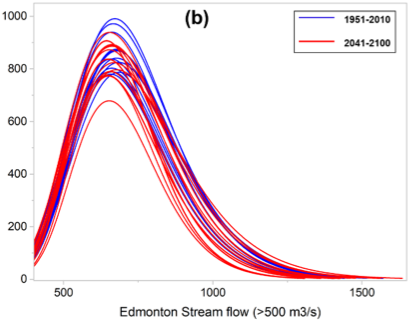
Figure 19: Comparison of frequency distributions of daily low (a) and high (b) flows of the NSR at Edmonton between a baseline from (1951 – 2010) and future (2041-2100) periods.
Changes in the magnitude and timing of extreme flows are illustrated in Figures 20 and 21 using outputs from the MESH model. Timing is shown with colour coding of the months. Figure 20 shows a dramatic mid 21st century shift in the timing and magnitude of low flows. There is a large increase in the range of flows and the timing shifts from late winter to late summer and throughout the fall. As winter becomes wetter and snow is replaced by rain, winter is no longer the season of minimum flow, and rather the timing of low flows reflects the drier summers and loss of snow and ice at high elevations which historically have maintained summer river levels.
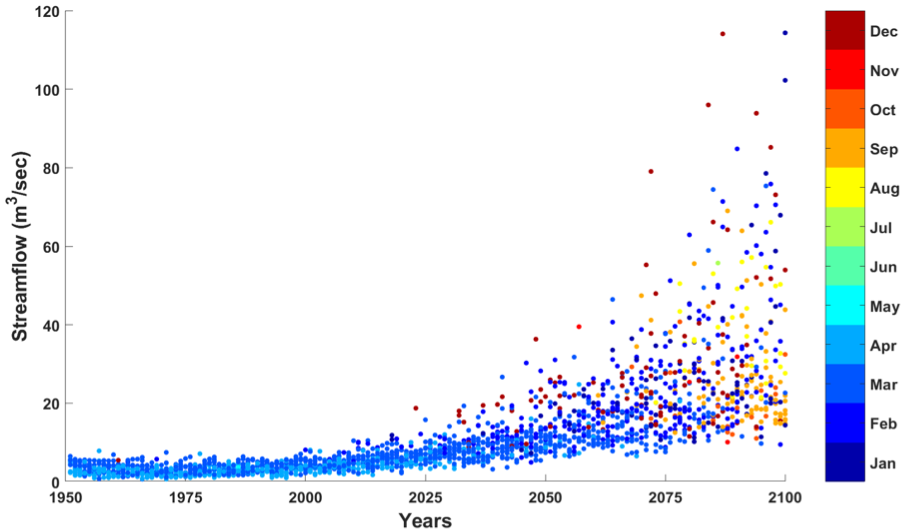
Figure 20: The magnitude and timing of daily low flows of the NSR at Edmonton derived from the MESH model run using the 15-member ensemble of bias-corrected data from CanRCM4 (RCP8.5).
Figure 21 suggests that the range of high flows also expands, with an unchanged minimum of about 500 m3/s but much high values than in the past approaching 5000 m3/s. The timing also shifts around mid 21st century with fewer maximum flows in late summer and fall, and an increased frequency in spring. Whereas historically rainfall runoff combined with the summer melt of snow and glacier ice produced high flows, earlier peak runoff and lower summer river levels will favour springtime maximum annual flows.
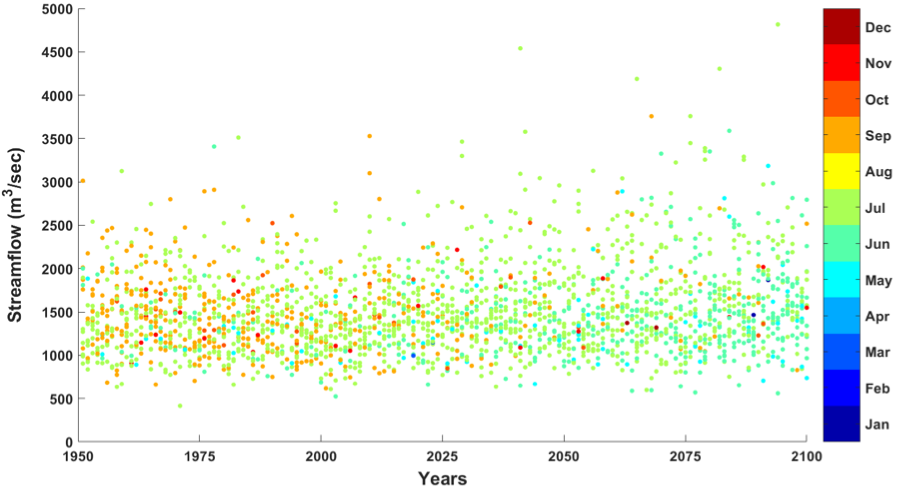
Figure 21: The magnitude and timing of daily high flows of the NSR at Edmonton derived from the MESH model run using the 15-member ensemble of bias-corrected data from CanRCM4 (RCP8.5).
Discussion
Our modeling and analysis of the future climate and hydrology of the North Saskatchewan River Basin (NSRB) gave results that have important implications for the availability, management and use of surface water in the Edmonton metropolitan area. Most of the recent climate change in this region has been an increase in the lowest temperatures, as minimum daily winter temperatures have increased by about 6° C. There is no significant trend in the instrumental record of precipitation. Fluctuations in precipitation over the past 120 years are dominated by large differences between years and decades. Future projections from climate models suggest warmer and wetter weather in winter and spring and, on average, drier conditions in mid to late summer.
In response to these projected climate changes, the seasonal pattern of river flow will shift, with future river levels peaking about one month earlier during May. More precipitation falling as rain rather than snow, combined with advanced spring snow melt, will result in earlier peak streamflows. Cold season (winter and early spring) flows will be significantly higher, and the timing of maximum annual flows will shift from summer to spring. As a warming climate intensifies the hydrological cycle, the range of river levels will expand, with larger departures from a shifting baseline of higher winter flows and lower summer flows.
Lower river levels in June to August will have implications for surface water supplies during the season of highest demand. Data from recent decades indicates that absolute water use and demand has increased but at a lesser rate than the increasing population of the Edmonton region (Anis et al., 2020). As a result, there has been a decoupling of per capita water use from growth in the economy and population of the region. Whereas this more efficient use of water supplies represents an important adaptation to a changing climate, other adjustments to water policy, planning and management will be required given the changes in climate and water supplies projected by our study.
Changes in the severity of extreme hydrological events, and in the seasonal distribution of water resources, will have major impacts on terrestrial and aquatic ecosystems, and on the availability of municipal and industrial water supplies (Sturm et al. 2017; Fyfe et al. 2017). Because water quality in the NSR is directly related to both runoff from the landscape and instream flows, it will be affected by climate change impacts on river flows and on runoff generated by precipitation and snowmelt. Higher concentrations of turbidity, colour, nutrients and algae are anticipated as a result of increased precipitation, a larger range of flows in the NSR, floods, droughts, forest fires, and higher water temperatures.
Both incremental long-term changes in water levels, and extreme fluctuations around the changing baseline, will have impacts requiring adaptation of water resource planning and policy. Water allocation and the design of storage and conveyance structures are based mainly on average seasonal water levels, but otherwise water resources are managed to prevent the adverse impacts of flooding and drought. The operation, and possibly structural integrity, of infrastructure for drainage, water supply, and treatment is vulnerable to climate change. Much of the risk is due to the expectation of more intense precipitation, prolonged low water levels, and more extreme weather events.
Acknowledgements
The research described in this paper was funded by EPCOR Utilities Ltd. and by the Natural Sciences and Engineering Research Council (NSERC) of Canada.
References
Abbott, B.W., K. Bishop, J.P. Zarnetske, et al. (2019). Human domination of the global water cycle absent from depictions and perceptions. Nature Geoscience, 12: 533-540. https://doi:10.1038/s41561-019-0374-y.
Anis, M.R., Y. Andreichuk, S.A. Kerr, and D.J. Sauchyn. 2020. Climate Change Risks to Water Security in Canada’s Western Interior; Chapter 2 in Proceedings of the Roorkee Water Conclave, Springer.
Asong, Z.E., H.S. Wheater, J.W. Pomeroy, A. Pietroniro, M.E. Elshamy, D. Princz, and A. Cannon (2018). WFDEI-GEM-CaPA: A 38-year high-resolution meteorological forcing data set for land surface modeling in North America. Earth System Science Data Discussions. https://doi.org/10.5194/essd-2018-128, 2018.
Asong, Z.E., M.E. Elshamy, D. Princz, H.S. Wheater, J.W. Pomeroy, A. Pietroniro, and A. Cannon (2020). High-resolution meteorological forcing data for hydrological modelling and climate change impact analysis in the Mackenzie River Basin. Earth System Science Data, 12: 629-645. https://doi.org/10.5194/essd-12-629-2020, 2020.
Barrow, E.B., D.J. Sauchyn (2019). Uncertainty in climate projections and time of emergence of climate signals in western Canada. The International Journal of Climatology, 39(11): 4358-4371. doi:10.1002/joc.6079.
Bonsal, B.R., D.L. Peters, F. Seglenieks, A. Rivera, A, and A.A. Berg (2019): Changes in freshwater availability across Canada; Chapter 6 in Canada’s Changing Climate Report, (ed.) E. Bush and D.S. Lemmen; Government of Canada, Ottawa, Ontario, p. 261–342.
Canada Centre for Remote Sensing. 2015. 2015 Land Cover of Canada. Land Cover of North America Collection, no. 4e615eae-b90c-420b-adee-2ca35896caf6. Ottawa. Version updated November, 2019. https://open.canada.ca/data/en/dataset/4e615eae-b90c-420b-adee-2ca35896caf6.
Fyfe, J., C. Derksen, L. Mudryk, G. Flato, B. Santer, N. Swart, N. Molotch, X. Zhang, H. Wan V. Arora, J. Scinocca and Y. Jiao (2017). Large near-term projected snowpack loss over the western United States. Nature Communications. doi:10.1038/NCOMMS14996
Golder Associates Ltd. (Golder). 2008. Water Supply Assessment for the North Saskatchewan River Basin. Report submitted to North Saskatchewan Watershed Alliance. March, 2008.
Kienzle, S.W., M.W. Nemeth, J.M. Byrne, and R.J. MacDonald (2012). Simulating the hydrological impacts of climate change in the upper North Saskatchewan River basin, Alberta, Canada. Journal of Hydrology, 412-413: 76-89. https://doi.org/10.1016/j.jhydrol.2011.01.058.
Kouwen, N., E.D. Soulis, A. Pietroniro, J. Donald, and R.A. Harrington (1993). Grouped response units for distributed hydrologic modelling. Journal of Water Resources Planning and Management, 119(3), 289-305.
Marvel, K., B.I. Cook, B.I., C. Bonfils, et al. (2019). Twentieth-century hydroclimate changes consistent with human influence. Nature, 569: 59–65. https://doi.org/10.1038/s41586-019-1149-8.
Matott, L.S. (2017). Ostrich: an Optimization Software Tool, Documentation and User’s Guide, Version 17.10.18. University at Buffalo, Center for Computational Research, Buffalo, NY. Retrieved from: www.eng.buffalo.edu./~lsmatott/software.html
Mekonnen, M.A., H.S. Wheater, A.M. Ireson, C. Spence, B. Davison, and A. Pietroniro (2014). Towards an improved land surface scheme for prairie landscapes. Journal of Hydrology, 511: 105-116. doi:10.1016/j.jhydrol.2014.01.020.
Mudryk, L.R., C. Derksen, S. Howell, F. Laliberté, C. Thackeray, R. Sospedra-Alfonso, V. Vionnet, P.J. Kushner, and R. Brown (2018). Canadian snow and sea ice: historical trends and projections, The Cryosphere, 12: 1157–1176. https://doi.org/10.5194/tc-12-1157-2018.
Pietroniro, A. and E. Soulis (2003). A hydrology modelling framework for the Mackenzie GEWEX programme. Hydrological Processes, 17(3): 673-676.
Pietroniro, A., V. Fortin, N. Kouwen, C. Neal, R. Turcotte, B. Davison, D. Verseghy, E.D. Soulis, R. Caldwell, N. Evora, and P. Pellerin (2007). Development of the MESH modelling system for hydrological ensemble forecasting of the Laurentian Great Lakes at the regional scale. Hydrology and Earthy System Sciences, 11: 1279–1294. https://doi.org/10.5194/hess-11-1279-2007.
Sauchyn, D., J. Vanstone, and C. Perez-Valdivia (2011). Modes and forcing of hydroclimatic variability in the Upper North Saskatchewan River Basin since 1063. Canadian Water Resources Journal, 36(3): 205-217.
Sauchyn, D.J., J. Vanstone, and J.M. St. Jacques (2015). Dendrohydrology in Canada’s western interior and applications to water resource management. Journal of Hydrology, 529: 548-558.
Sauchyn, D.J. and N. Ilich (2017). Nine hundred years of weekly streamflows: stochastic downscaling of ensemble tree-ring reconstructions. Water Resources Research, 53(11): 9266-9283.
Scinocca, J. F., V.V. Kharin, Y. Jiao, M.W. Qian, M. Lazare, L. Solheim, and B. Dugas (2016). Coordinated global and regional climate modelling. Journal of Climate, 29: 17–35. doi:10.1175/JCLI-D-15-0161.1.
Soulis E.D., K.R. Snelgrove, N. Kouwen, F. Seglenieks, D.L. Verseghy (2000). Towards closing the vertical water balance in Canadian atmospheric models: Coupling of the land surface scheme CLASS with the distributed hydrological model Watflood. Atmosphere-Ocean, 38(1): 251-269. doi: 10.1080/07055900.2000.9649648.
St. Jacques, J-M., D.J. Sauchyn, and Y. Zhao (2010). Northern Rocky Mountain streamflow records: Global warming trends, human impacts or natural variability? Geophysical Research Letters, 37(6). https://doi.org/10.1029/2009GL042045.
Sturm, M., M. Goldstein, and C. Parr (2017): Water and life from snow: A trillion-dollar science question. Water Resources Research, 53: 3534-3544. doi:10.1002/2017WR020840.
Tennant, C. and B. Menounos (2013). Glacier change of the Columbia Icefield, Canadian Rocky Mountains, 1919–2009. Journal of Glaciology, 59(216): 671-686. https://doi:10.3189/2013JoG12J135.
Verseghy, D. (1991). CLASS – A Canadian land surface scheme for GCMs. I. Soil model. International Journal of Climatology, 11(2): 111-133. doi:10.1002/joc.3370110202.
Verseghy, D., N.A. McFarlane, and M. Lazare (1993). CLASS – A Canadian land surface scheme for GCMs, II. Vegetation model and coupled runs. International Journal of Climatology, 13(4): 347-370. doi:10.1002/joc.3370130402.